Month End June 2021 Comments

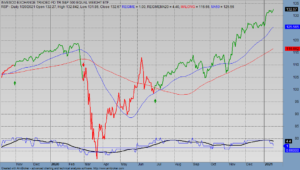
The S&P 500 tracking ETF SPY rose 1.3% in the month of June.  Analysis of the FRED economic data show that the economy is still in Phase 2 (late growth cycle), which is good for equities.


The ETF Portfolio technical investing algorithm calls for a July 1 investment in International Bonds (EDV), Emerging Market Bonds (EMB), and long term Treasury bonds (VCLT).  This is consistent with increase in the flow of monies into bond funds, which indicates that people are hedging these equity ETF bets.  There is too much money chasing too little sources of return, so even low paying bonds are getting play here.   read more

V54 Released – Added Breadth Analysis to Model

I have added a check on Breadth to the base algorithm.  This is looking at the number of stocks reaching new highs versus new lows, the number of stocks advancing versus declining, and the number of stocks above or below their 21dma.  It looks at this data across the S&P100 (very large caps), S&P500, S&P400 (midcaps), and S&P600 (small caps).  Version 54 performs with a higher RAR and higher Win Percentage than V53.  read more

V53 Model Refinement Using Fidelity Economic Cycle Analysis

The linking of economic cycles with the technical investing algorithms is an important part of our ETF algorithm.  The model has been updated to Version 53 to include refined economic criteria.


In Version 53 the trade entry logic was further refined using an analysis that was conducted by Fidelity Investments and summarized in the table below.  As a result of this refinement the backtesting results (1/1/2003 – current period for our target ETF securities) for the algorithm have improved slightly: read more

Algorithm Comparison to Previous Versions

Attached are comparison’s of the latest algorithm to two previous versions. In version 44, we attempted to replace and remove select ETF’s to see the impact. Overall Annual RoR increased from 8.34% to 8.41%.

In version 45.2, Annual RoR increased to 9.49% by Mark introducing economic indicators into the model. I will let “the Dr.” go into more detail about the changes.

For those who want to explore the data/results in more detail, I will post/share the Power BI report in the Portfolio Slicer topic area. The latest data from v45.2 is already loaded into the model. I will elaborate in more detail about the Power BI report in that post. read more

Version 46 with kiplinger 20 ETFs

Version 46 with Kiplinger 20 ETF data

Attached are the results from running the V46 algorithm with Kiplinger 20 ETF data. RAR, Win/Loss% are similar to that with Bucket ETFs. MaxDD is higher because this universe of ETFs likely has a bit larger beta. Exposure is a bit lower due to the predominance of equity ETFs. read more

economic summary 1/17/2021

Economic Summary 1/17/2021

In the lower part of the chart below you can see that the difference between Phase 1&2 (expansion) and Phase 3&4 (Contraction) remains high at 4. You can also get to that math by adding the Phase 1 and 2 totals from the count below and subtracting Phase 3 & 4. Historically that bias of 4 is high. It presumes that the risk of investing in assets that are correlated to the economy is low at this point.

The model is invested in two Bond funds (MUB, BNDX) but also in commodities (PDBC), and as long as the correlation between bonds and the overall market remains positive I suspect that the algorithm will not change its opinion.

Phase Predictor Indicator
Phase 1 Total = 2
Phase 2 Total = 4
Phase 3 Total = 3
Phase 4 Total = 0 read more

OTM Technical Model – Updated Backtesting Results

Attached is the most recent backtest report for the technical model.  This was run against the 2432 symbols of the NASDAQ composite for as far back as there are active symbols — trades start in 1981.

Capture3

1_ Portfolio Equity


Portfolio equity increases as one might expect.  There are losses in only 4 years of the 35 year period (1981, 1984, 1988, 2008), and three of the four years the losses are single digit.  By far the worst loss is 19% in 2008.

Risk adjusted return — that is, the return of monies actually invested — is 28.89%.  The average length of time of a trade is 89 trading days, or a little over 4 months.

Winners are held about 100 days longer than losers, and the win percent is not quite 50%.  This is not particularly troublesome.  You get out of losers quickly, and you ride the winners.

The attached backtest listing is a summary of the trades, including those that are still “open”.

07062013 final v76 backtest

I would welcome any input to make this better.  This is the algorithm that drives my technical charts.