Attached is the most recent backtest report for the technical model. This was run against the 2432 symbols of the NASDAQ composite for as far back as there are active symbols — trades start in 1981.
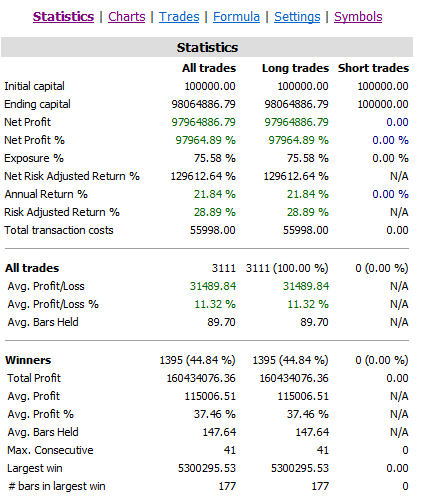

Portfolio equity increases as one might expect. There are losses in only 4 years of the 35 year period (1981, 1984, 1988, 2008), and three of the four years the losses are single digit. By far the worst loss is 19% in 2008.
Risk adjusted return — that is, the return of monies actually invested — is 28.89%. The average length of time of a trade is 89 trading days, or a little over 4 months.
Winners are held about 100 days longer than losers, and the win percent is not quite 50%. This is not particularly troublesome. You get out of losers quickly, and you ride the winners.
The attached backtest listing is a summary of the trades, including those that are still “open”.
I would welcome any input to make this better. This is the algorithm that drives my technical charts.