V53 Model Refinement Using Fidelity Economic Cycle Analysis

The linking of economic cycles with the technical investing algorithms is an important part of our ETF algorithm.  The model has been updated to Version 53 to include refined economic criteria.


In Version 53 the trade entry logic was further refined using an analysis that was conducted by Fidelity Investments and summarized in the table below.  As a result of this refinement the backtesting results (1/1/2003 – current period for our target ETF securities) for the algorithm have improved slightly: read more

George Dagnino Market Opinion January 27

In a post in SeekingAlpha on January 27th of this year (https://seekingalpha.com/article/4401277-market-and-earning-cycles-point-to-pause-in-2022 George Dagino wrote:


“The last bottom of the business cycle took place in March 2020. Growth should therefore show a peak in 2022, assuming the upward leg of the cycle is two years. This should be also the time growth in earnings will begin to slow down. read more

Retirement Strategy Portfolio – ETF Selection Process – Overview and Introduction

I have spent numerous hours researching ETF’s to include in our model portfolio.  As Mark has shared in other posts, we are using the “Three Bucket” approach recommended by Christina Benz with Morningstar.  In her articles, she includes investments for the three buckets for a moderate and aggressive portfolios.  If you are interested in the articles and unable to find them based upon Mark’s previous posts or doing Bing or Google searches, let me know and I will gladly share. read more

Algorithm Comparison to Previous Versions

Attached are comparison’s of the latest algorithm to two previous versions. In version 44, we attempted to replace and remove select ETF’s to see the impact. Overall Annual RoR increased from 8.34% to 8.41%.

In version 45.2, Annual RoR increased to 9.49% by Mark introducing economic indicators into the model. I will let “the Dr.” go into more detail about the changes.

For those who want to explore the data/results in more detail, I will post/share the Power BI report in the Portfolio Slicer topic area. The latest data from v45.2 is already loaded into the model. I will elaborate in more detail about the Power BI report in that post. read more

version 45 economic notes

Version 45 trades version 2

I revised the economic indicators for accuracy. The RAR increased to 9.82% with 82% exposure. MDD is -16.23%, relatively unchanged. Two open Bond positions with BNDX and MUB.

Economic Interpretation is 6-3 in favor of indicating that we are in an expansion period, as follows:

Version45
Phase 1: Expansion leaving Trough
Phase 2: Expansion approaching Peak
Phase 3: Contraction leaving Peak
Phase 4: Contraction approaching Trough

DGS3MO 90-day Treasury Indicator
DGS3MOprice=0.1
Phase Prediction=1

DBC COMMODITY INDICATOR
DBC price=15.3
Phase Prediction=2

SPY BROAD MARKET INDICATOR
SPY price=375.7
Phase Prediction=2

UNRATE BROAD MARKET INDICATOR
SPY price=6.7
Phase Prediction=2

HOUST HOUSING STARTS CONFIRMATION
HOUST price=1547
Phase Prediction=3

VIXCLS CBOE Volatility Indicator
Phase Prediction=3

CP CORPORATE PROFITS CONFIRMATION
CP price=2118.86
Phase Prediction=3

TWEXM US DOLLAR INDICATOR
TWEXM price=91.5077
Phase Prediction=2

XLU UTILITIES INDICATED PHASE
XLU price=62.99
Phase Prediction=1

Phase Predictor Indicator
Phase 1 Total = 2
Phase 2 Total = 4
Phase 3 Total = 3
Phase 4 Total = 0

Expansion Ind = 1 Contraction Ind = 0 read more

economic summary 1/17/2021

Economic Summary 1/17/2021

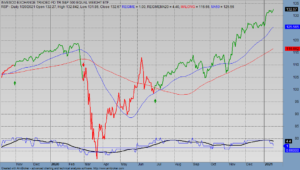
In the lower part of the chart below you can see that the difference between Phase 1&2 (expansion) and Phase 3&4 (Contraction) remains high at 4. You can also get to that math by adding the Phase 1 and 2 totals from the count below and subtracting Phase 3 & 4. Historically that bias of 4 is high. It presumes that the risk of investing in assets that are correlated to the economy is low at this point.

The model is invested in two Bond funds (MUB, BNDX) but also in commodities (PDBC), and as long as the correlation between bonds and the overall market remains positive I suspect that the algorithm will not change its opinion.

Phase Predictor Indicator
Phase 1 Total = 2
Phase 2 Total = 4
Phase 3 Total = 3
Phase 4 Total = 0 read more

Collaboration

This site is designed to allow collaboration among people who are managing or intending to manage their retirement investments themselves.

The important elements of retirement investing are covered including stock/ETF selection, asset allocation, rebalancing, BUY/SELL timing. What is out of scope is retirement budgeting, expense management, and other financial planning topics such as estate planning.

One of the elements of the site is a monthly strategy that is designed to provide low risk return with a predictable income stream. This strategy is grounded in technical investing theory as well as economic theory. It is designed to be reviewed and managed on a monthly basis.

Review the various postings on the site at your leisure. And “follow” topics of interest to get emails as updates are created. read more