george dagnino

Our analytic approach is designed to link technical investing techniques with economic data. This is described in many of the presentations by George Dagnino. We are attempting to automate this approach using the Amibroker trading software for convenience.

Dagnino’s books that we are baking into this analysis include “Easy Ways to Beat the Market with ETFs” and “Profiting in Bull or Bear Markets”.

https://www.peterdag.com/ read more

Updated Technical Model with Unusual Signal

I have not posted in some time but have been refining the technical model.  It has been subject to about 25 version updates, and I am preparing for a call on what will likely be a material up or down movement in the market.  There is a history of such a thing when the market trades for some time in a narrow range, as it has since July.

In any event, note the technical trend for Largecap, Midcap, Smallcap, Microcap, Longbond, Gold, and Real Estate in the box below.  They are all BUY in all periods.  That is (historically) unusual, and counter to long term correlation — as you can see by the Correl (correlation) column, these asset groups are not highly correlated yet they are all BUY in the model and generally have all been trending upwards due to the worldwide search for yield.

All of this to the point that it is about time to begin to fly the plane using Instrument Flight Rules instead of Visual Flight Rules, as it is going to start getting stormy.  Data typically reverts to its mean, and in this case, at some point, these relationships are going to begin to diverge back to historic patterns.

I have been preparing for such a thing in the model and will be issuing updates appropriately.  If you have a particular security that you’d like a snapshot on let me know.

Mark

OTM Investing Update – well, it depends on your timeline….

On an hourly basis, the technical model would have had you buy the S&P at 1967 on March 1.  The S&P closed at 2072 on April 1.  So were we to play that game, investing using hourly data, then we would be long the market.

Based on daily closing data however we continue to be out of the market, selling at 1970 and yes being out during the last run-up, as well as out during the interim drops to as low as 1850.  This model is designed to be intermediate term, and it is biased against large draw downs.  So the trend will have to fully reestablish before it will bring you back into this market.  Historically it has a 78% win percentage and I believe that over time it will be useful.

The long bonds had a buy signal at 123 and are presently at 130.  There is near term volatility with every word out of the Fed, but for the moment it still makes sense to hold bonds for their relative predictability.

I have begun to experiment with adding market wide breadth and other indicators to the model including Bullish Percentage, which in one flavor is the percentage of S&P stocks that are bullish based on Point and Figure charting.  I expect that this should further improve the intermediate and long term results.

04022016 TLT daily 04022016 GSPC daily 04022016 GSPC hourly

OTM Market Update – Inspection

The best way to understand the market is to look at it in various timeframes.

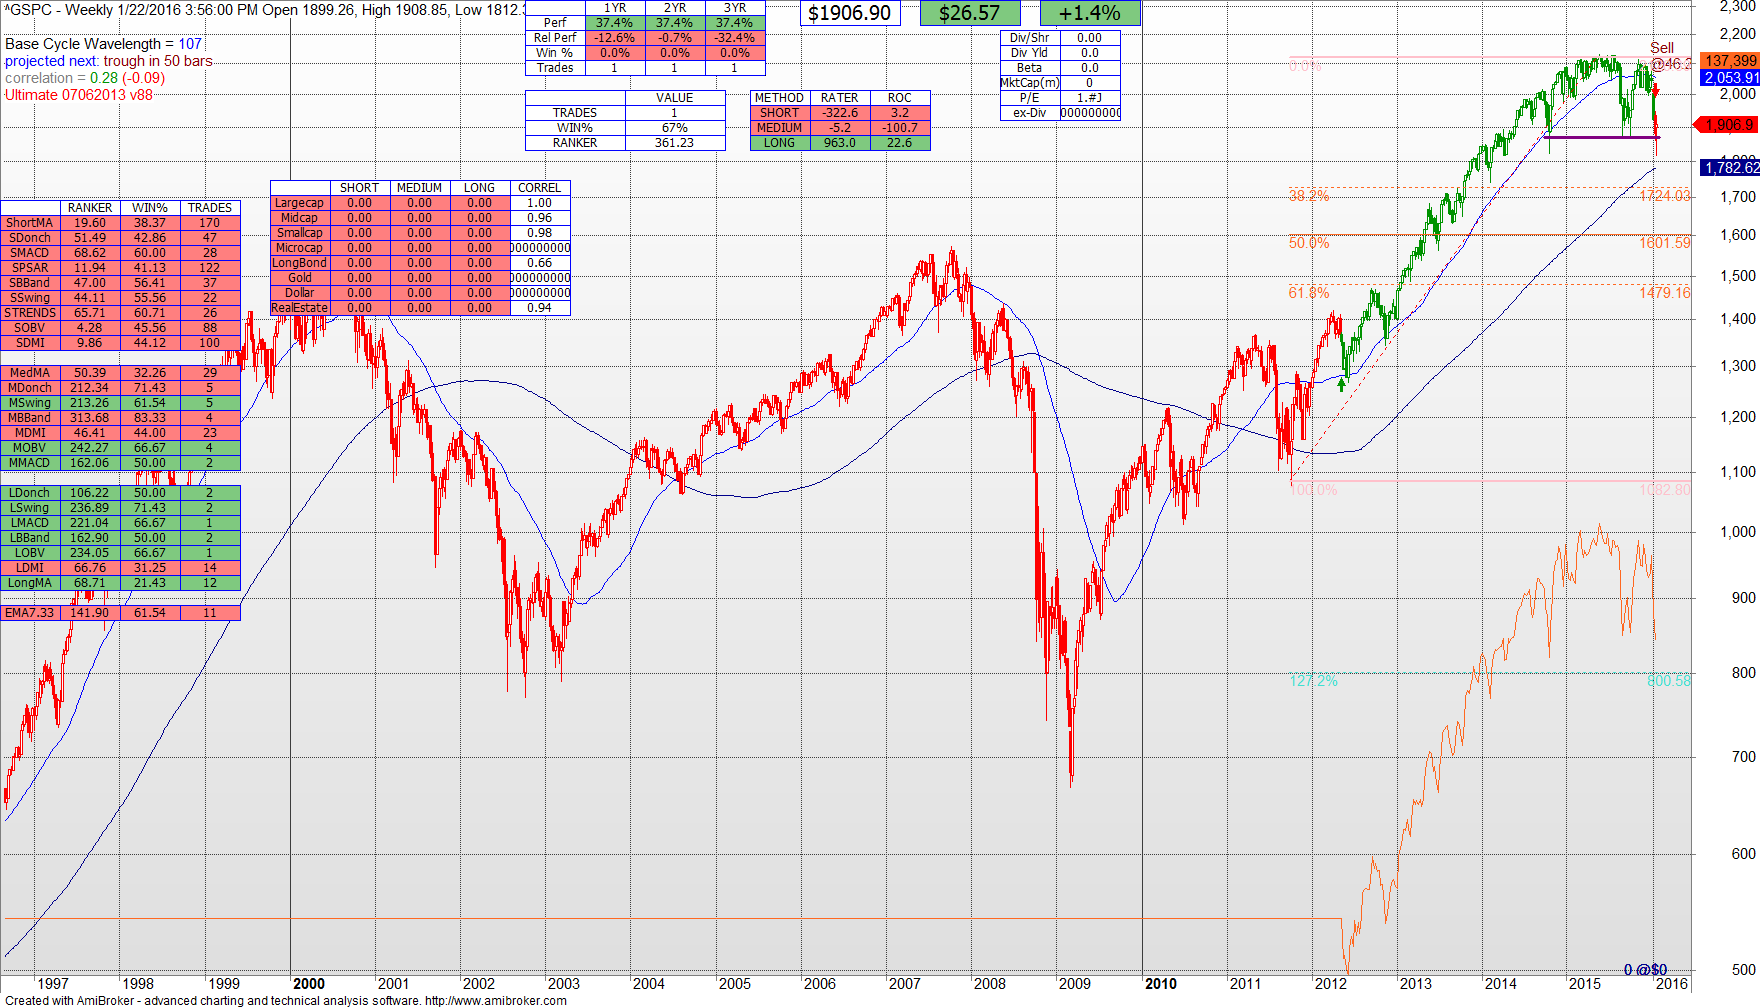
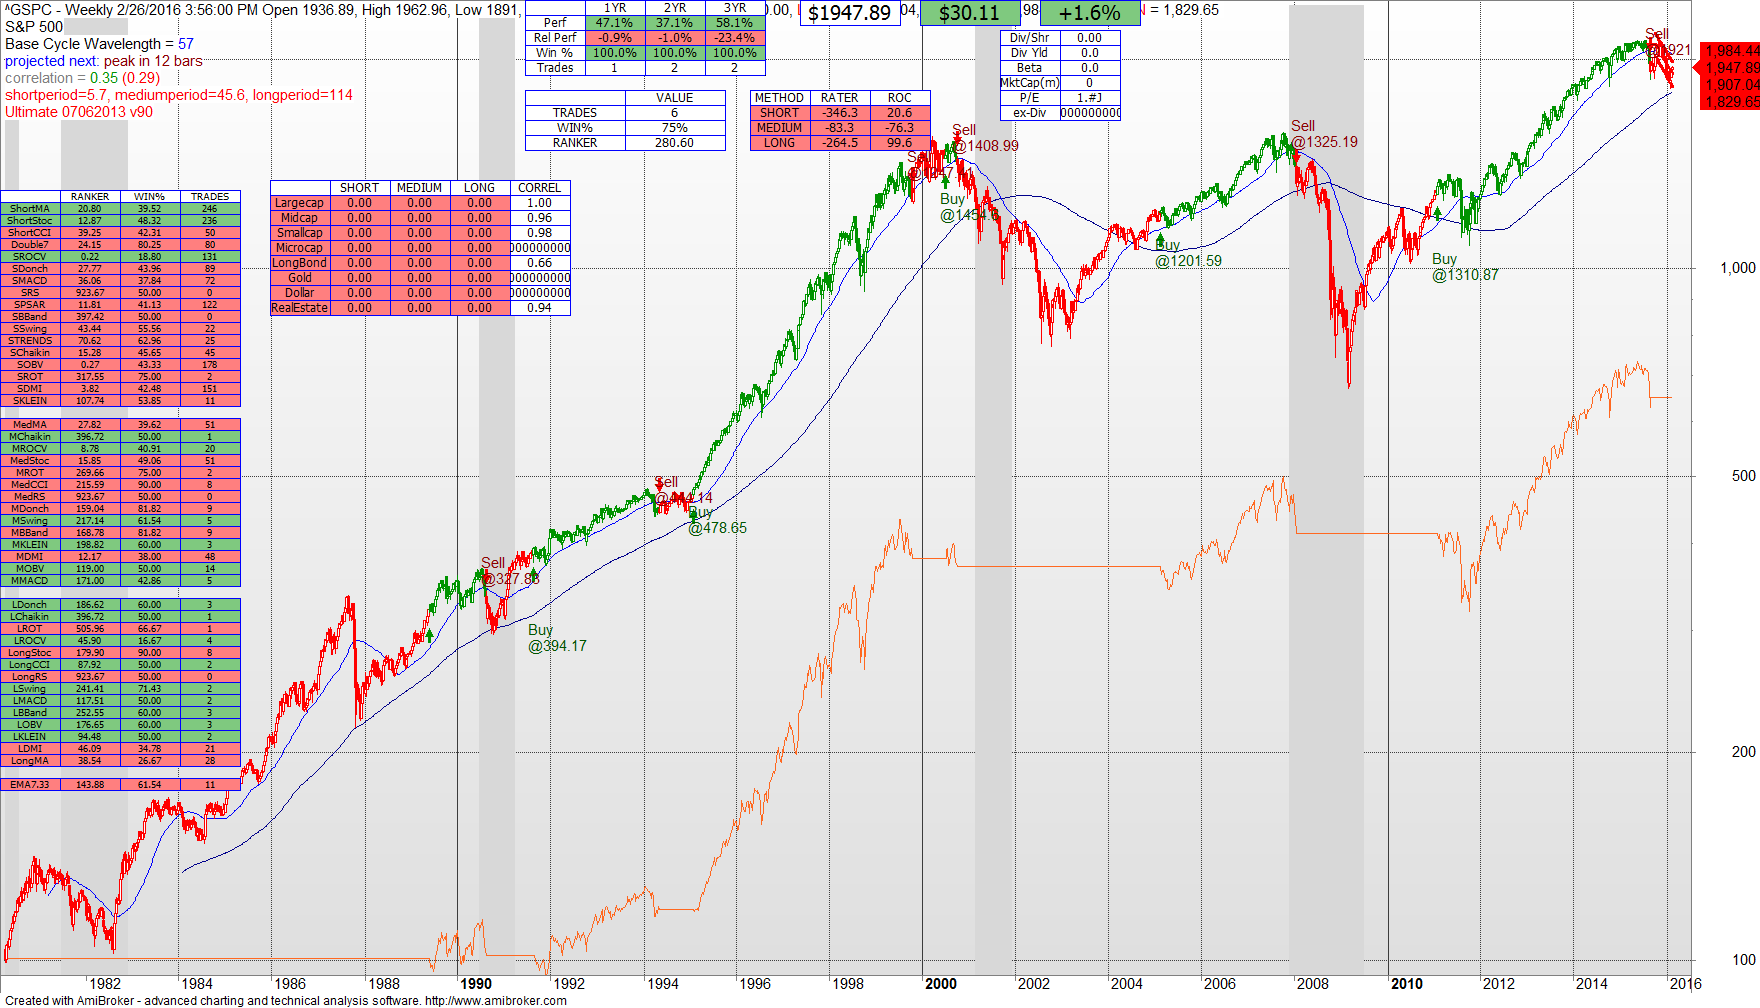
Below is a picture of the S&P since 1982.  The shaded areas are official “recessionary” periods.  At a weekly level the technical model is saying Sell in all periods.  So we start with the overarching long term trend as downward.

02282016 GSPC W


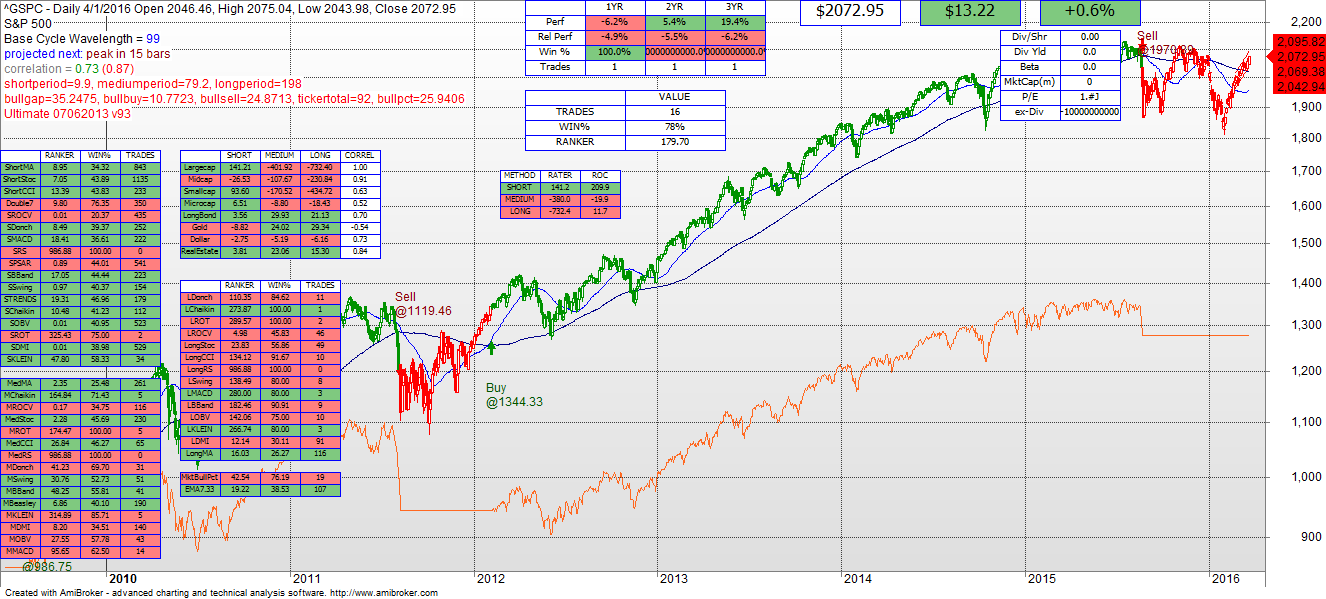
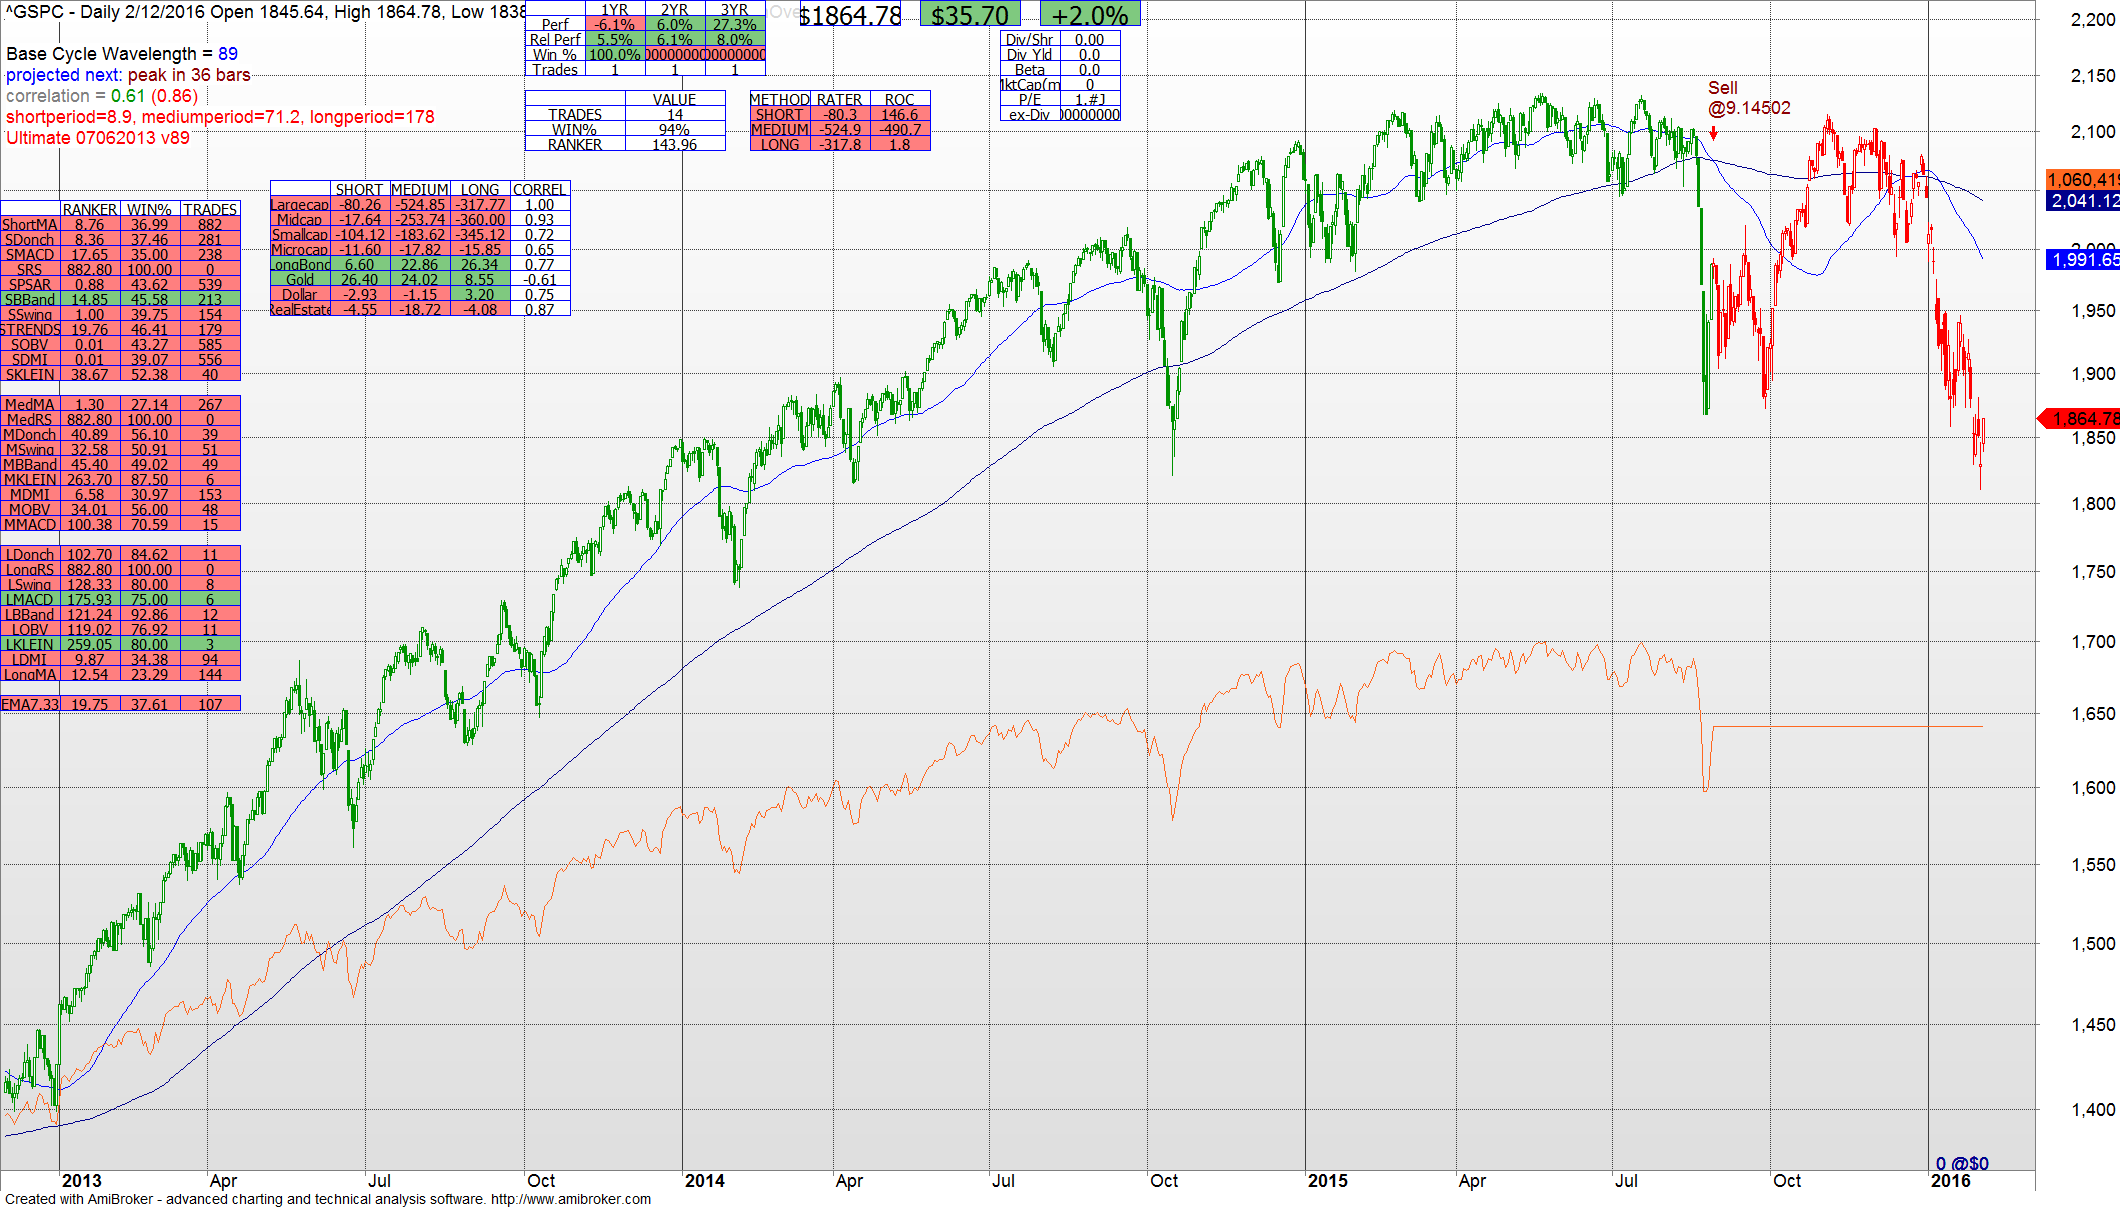
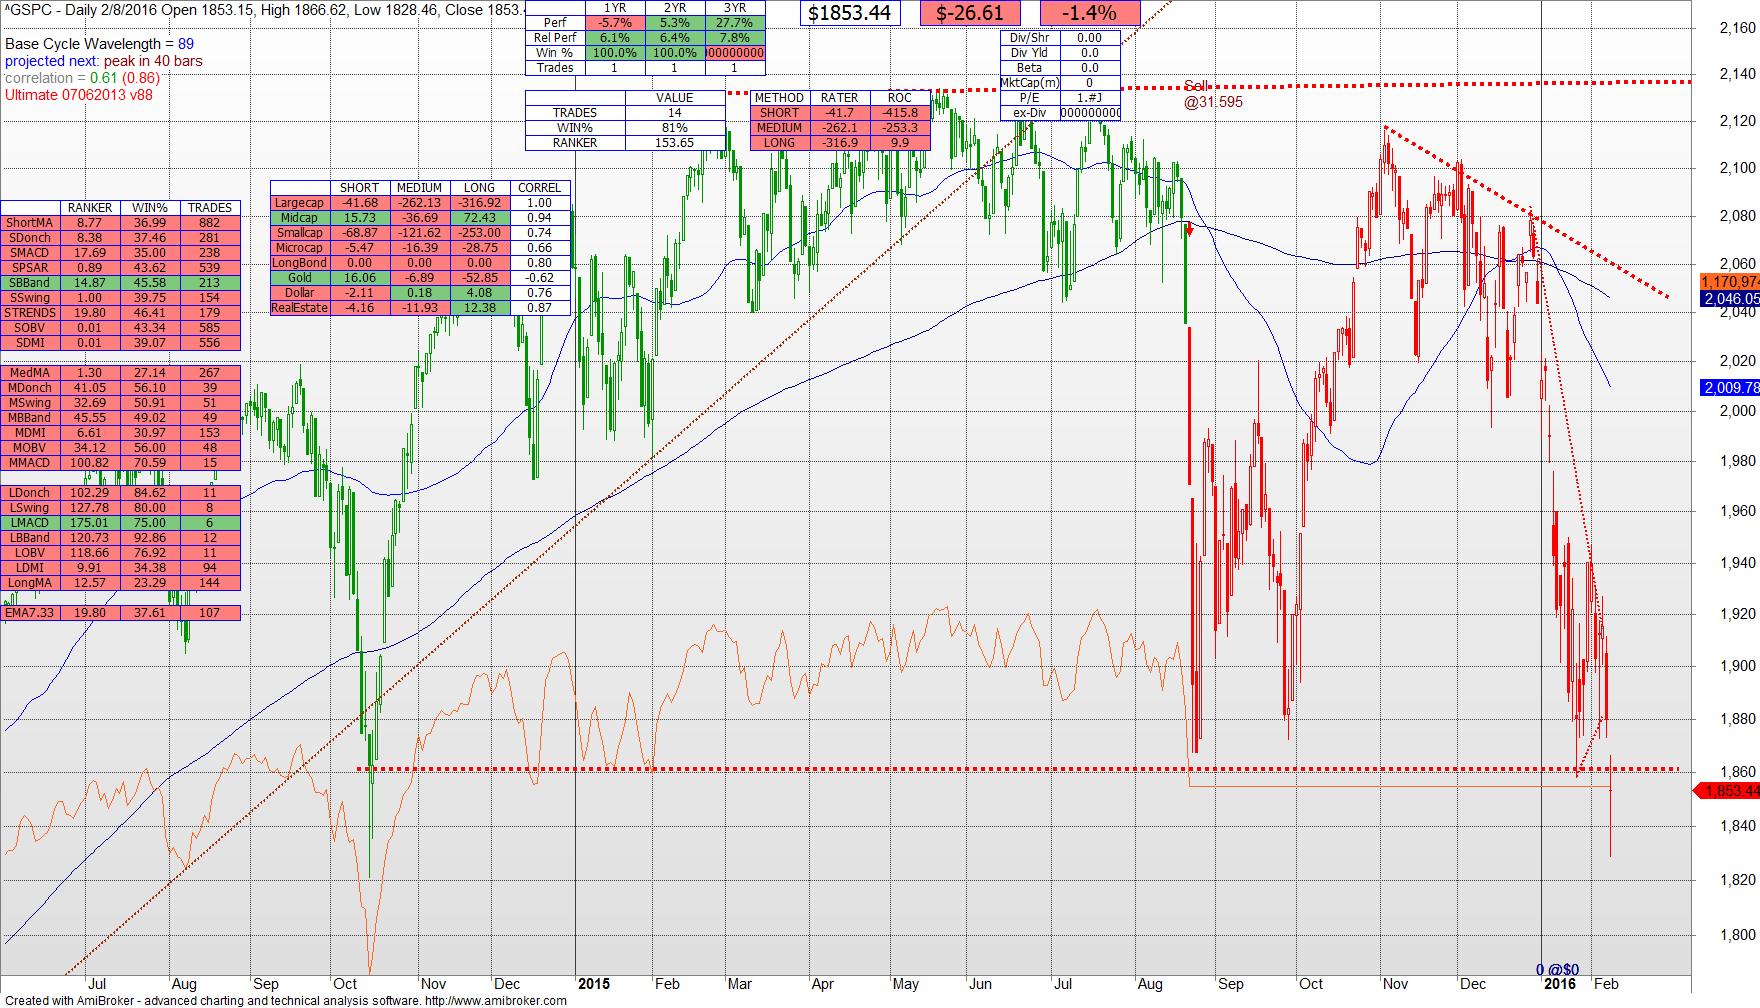
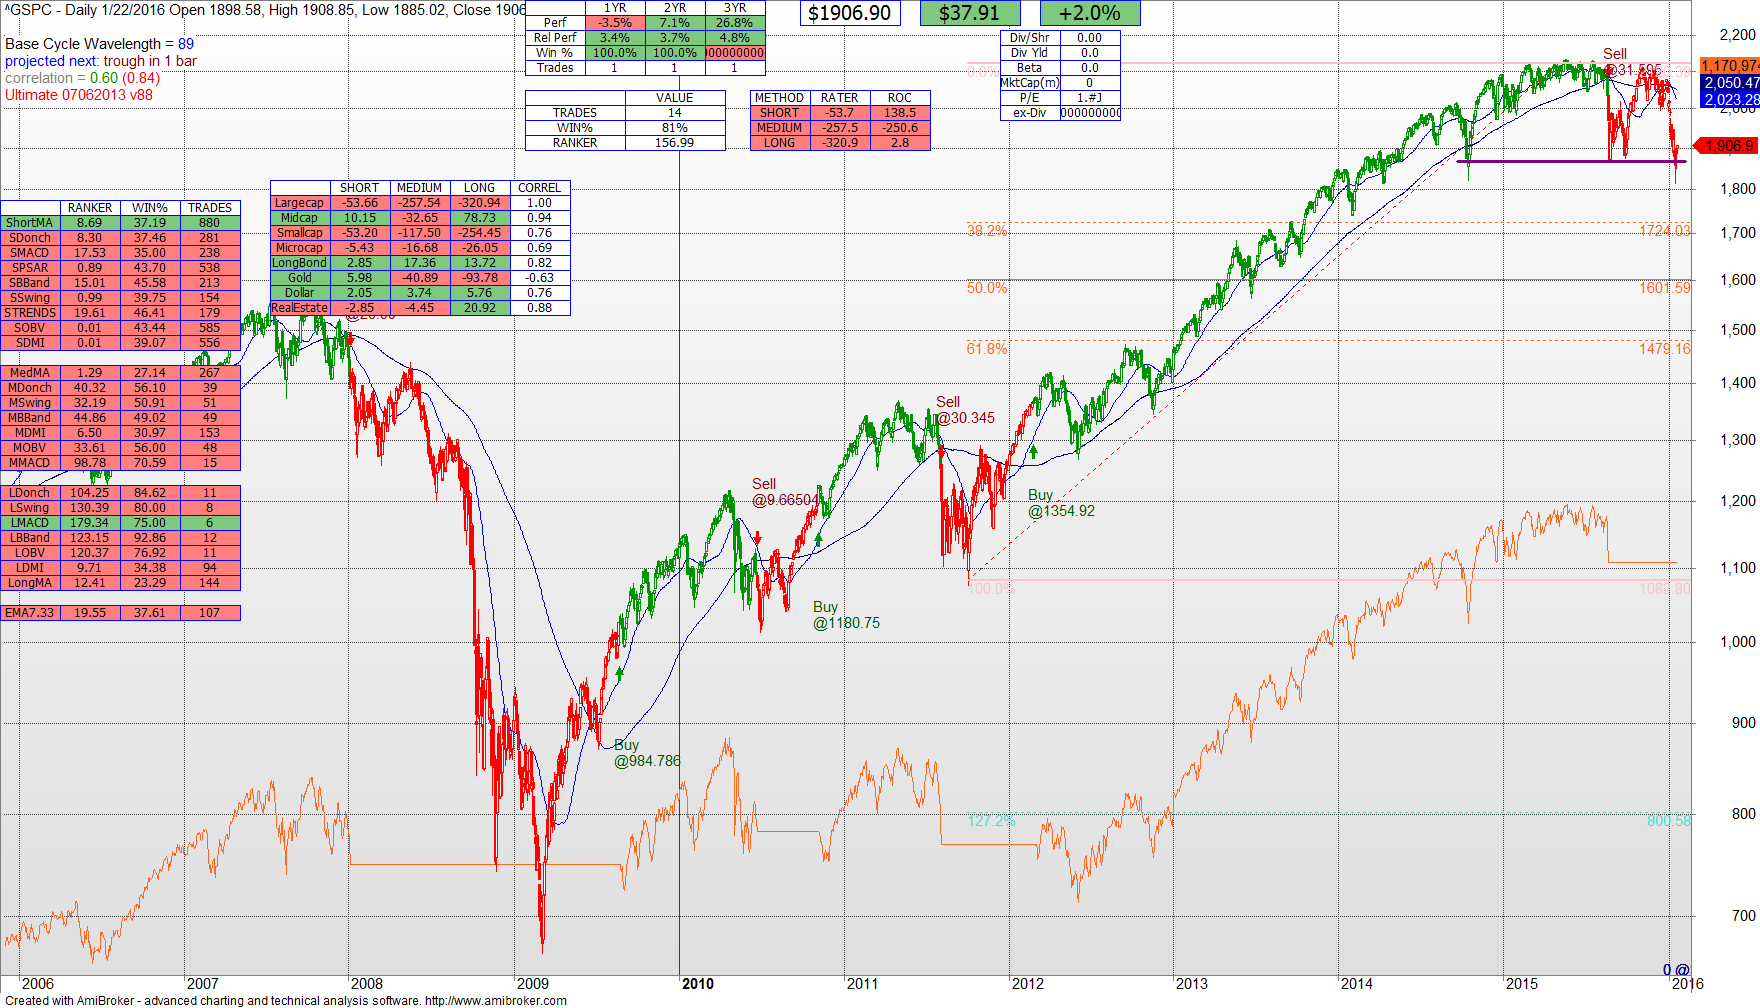
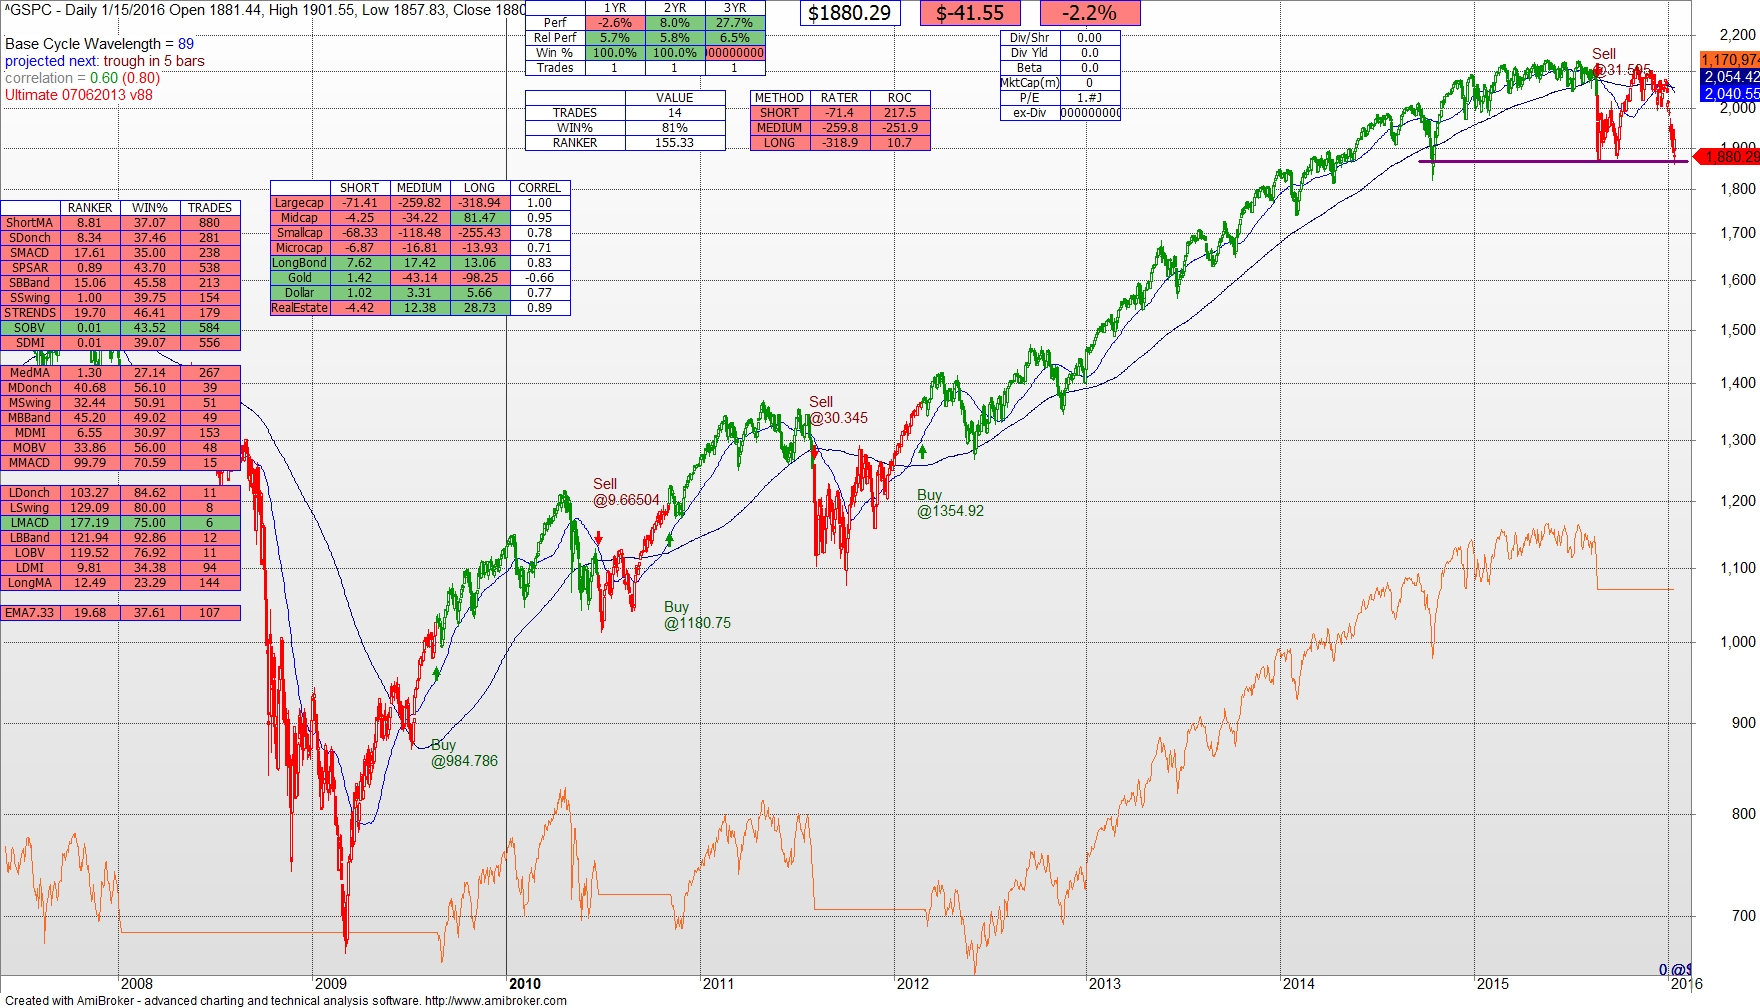
A Daily view of the S&P also reveals weakness.  The technical model is Sell in the Intermediate and Long term, consistent with the broader Weekly view.  Note that the S&P is a BUY in the short term view.

02282016 GSPC D


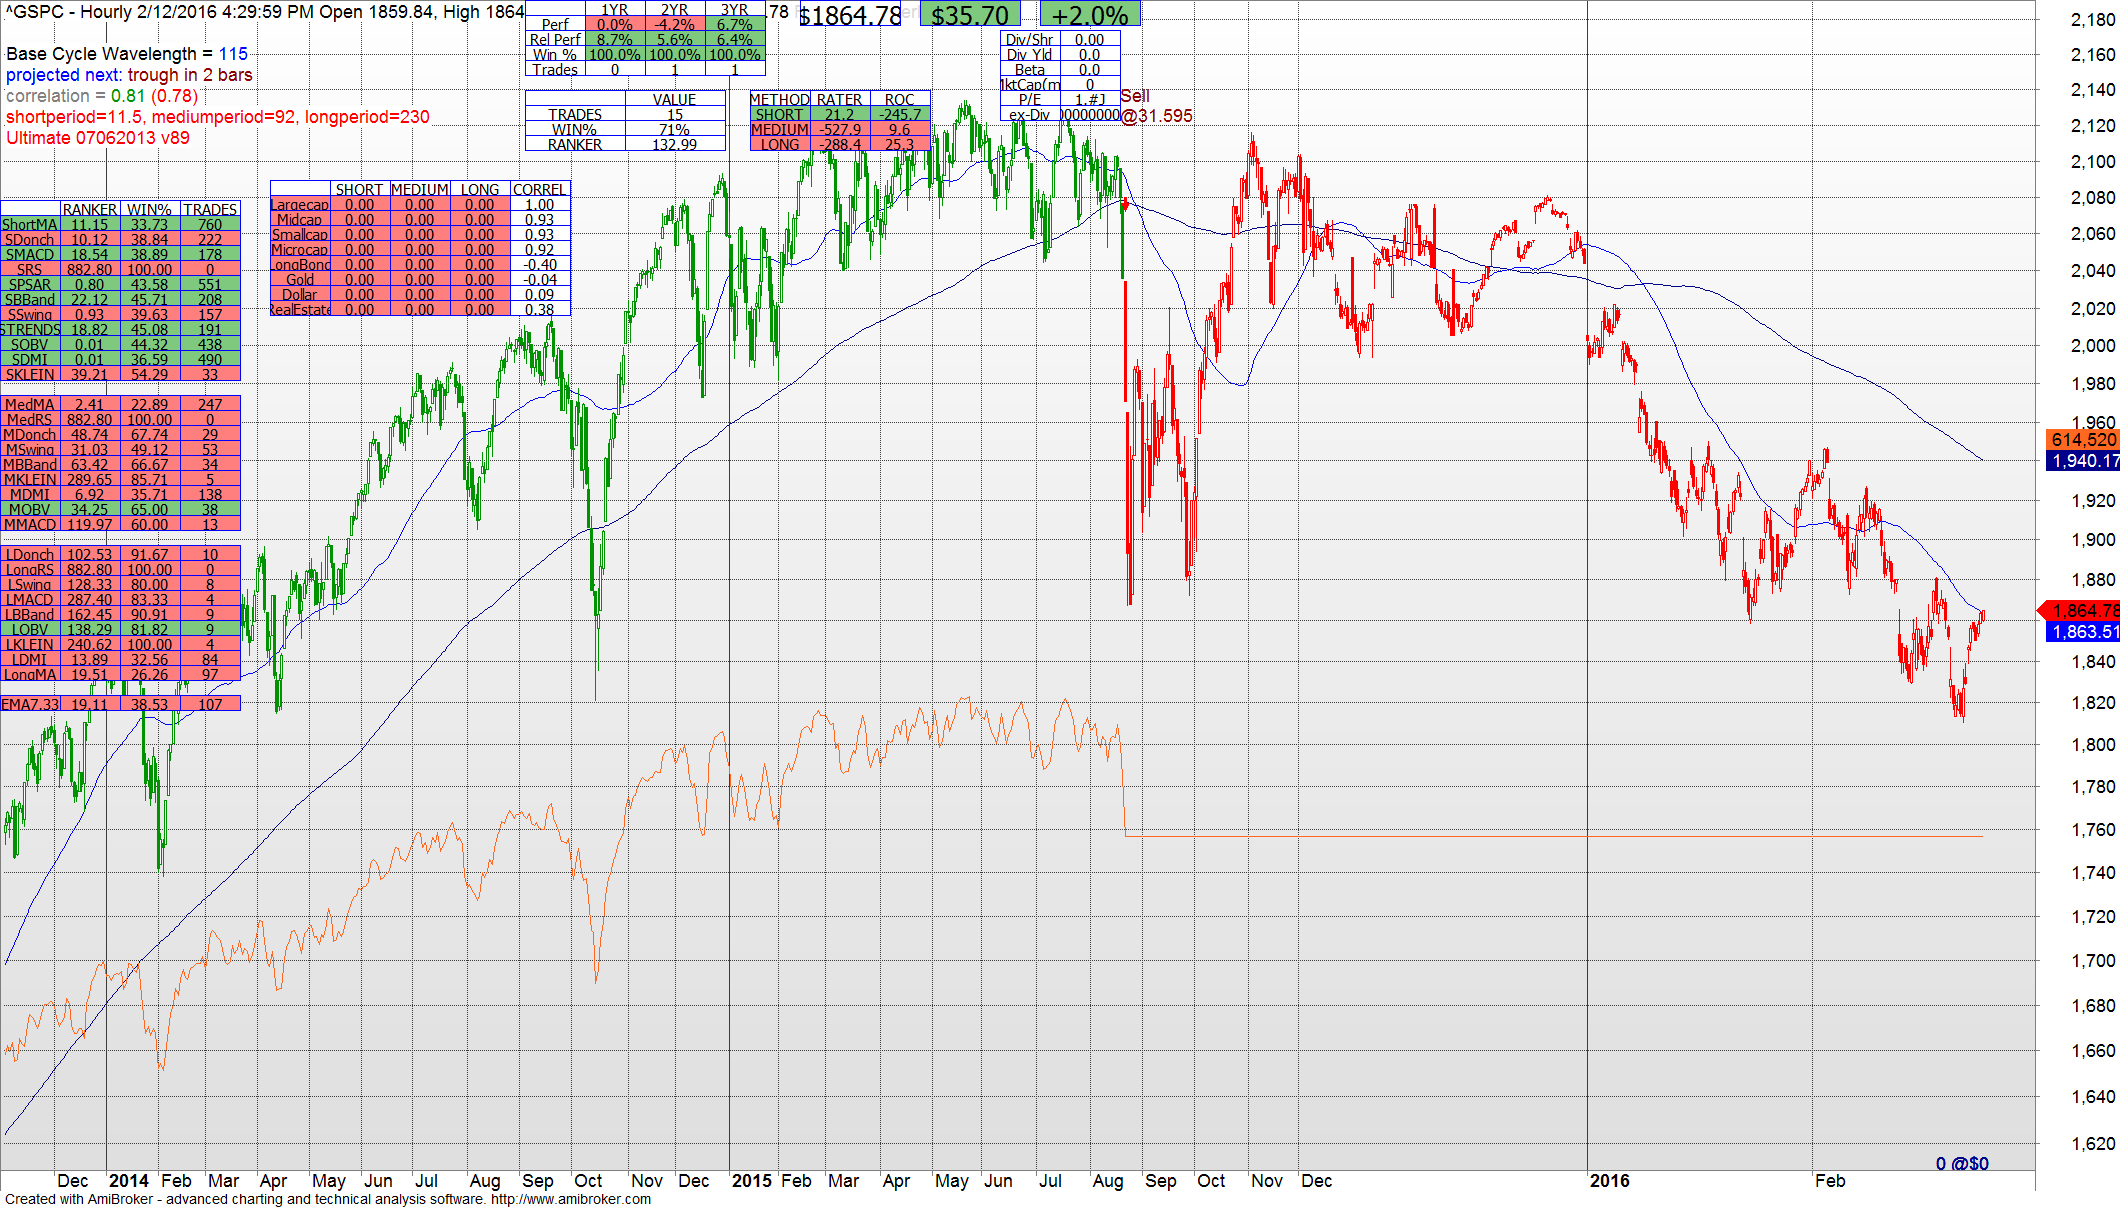
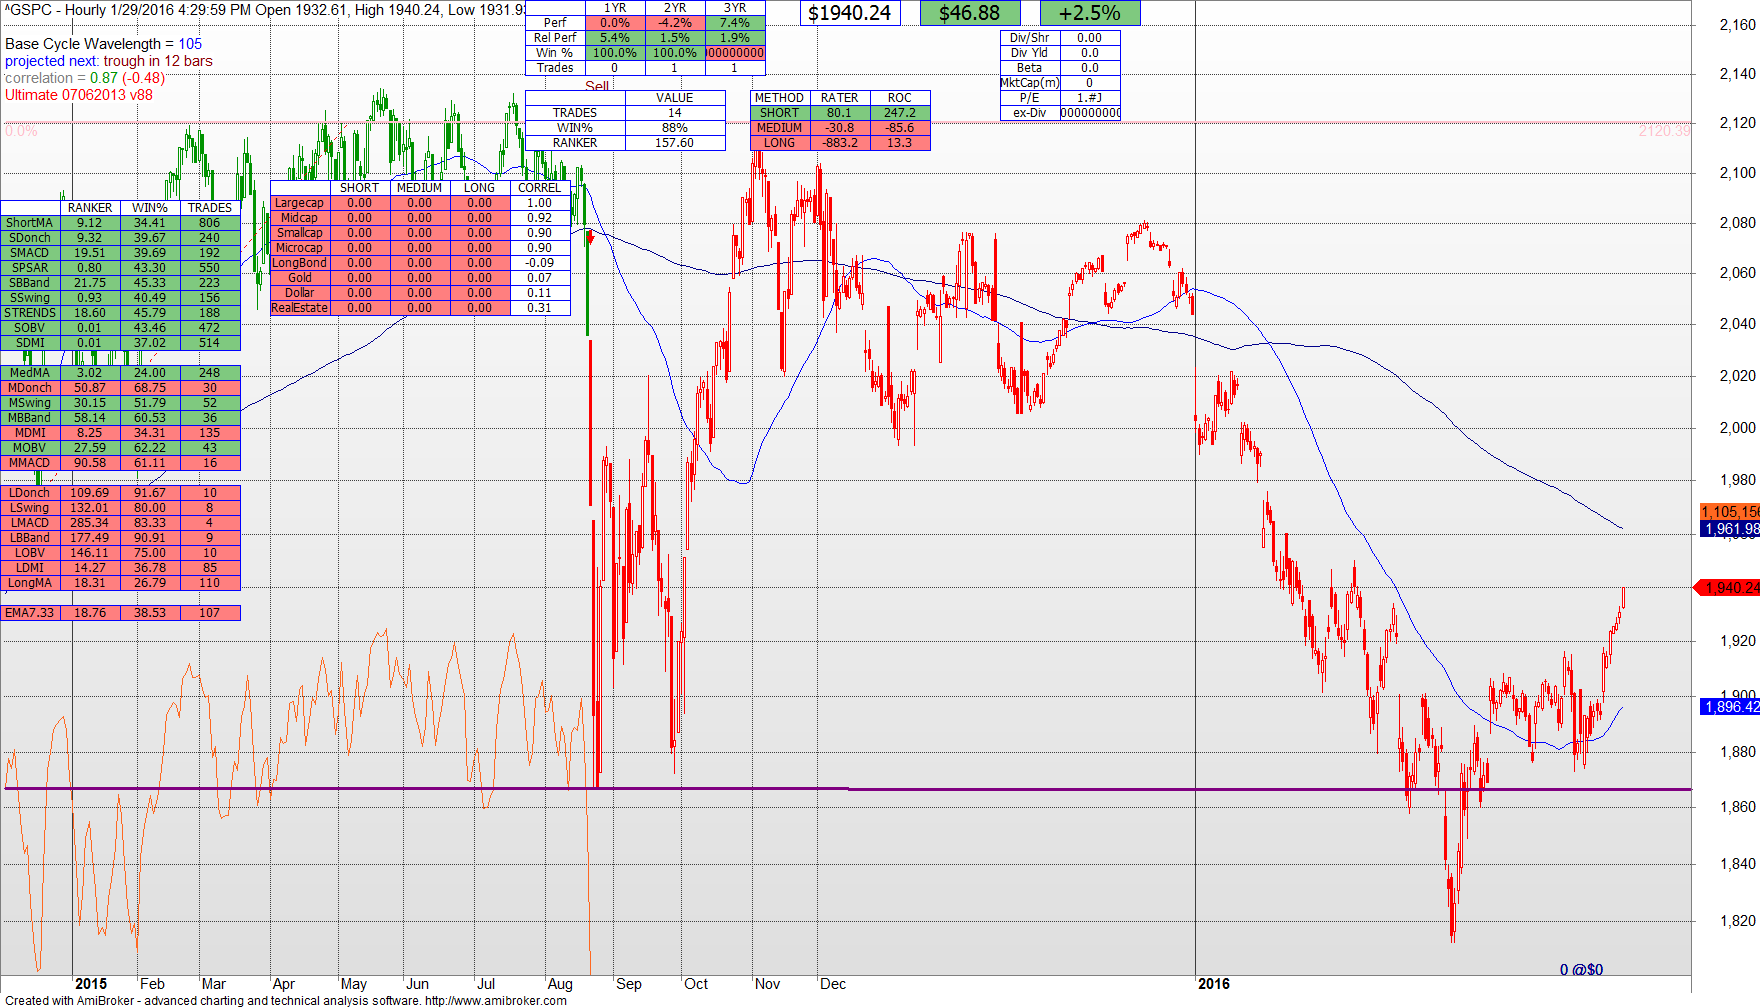
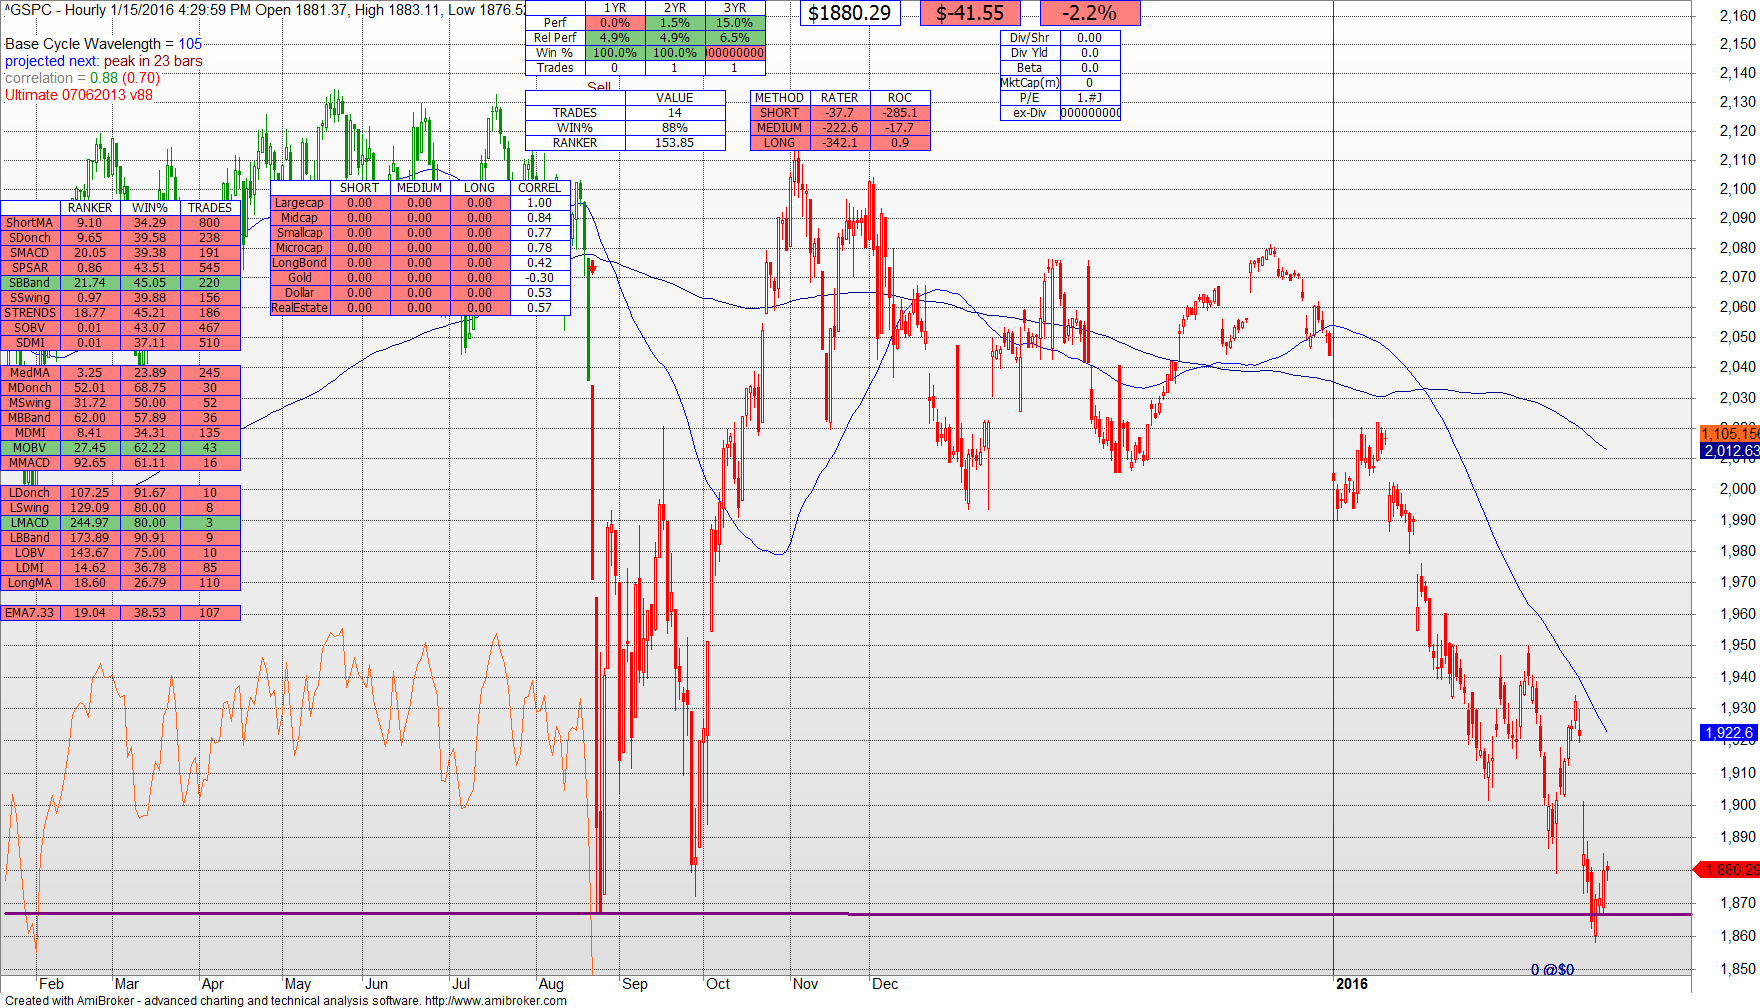
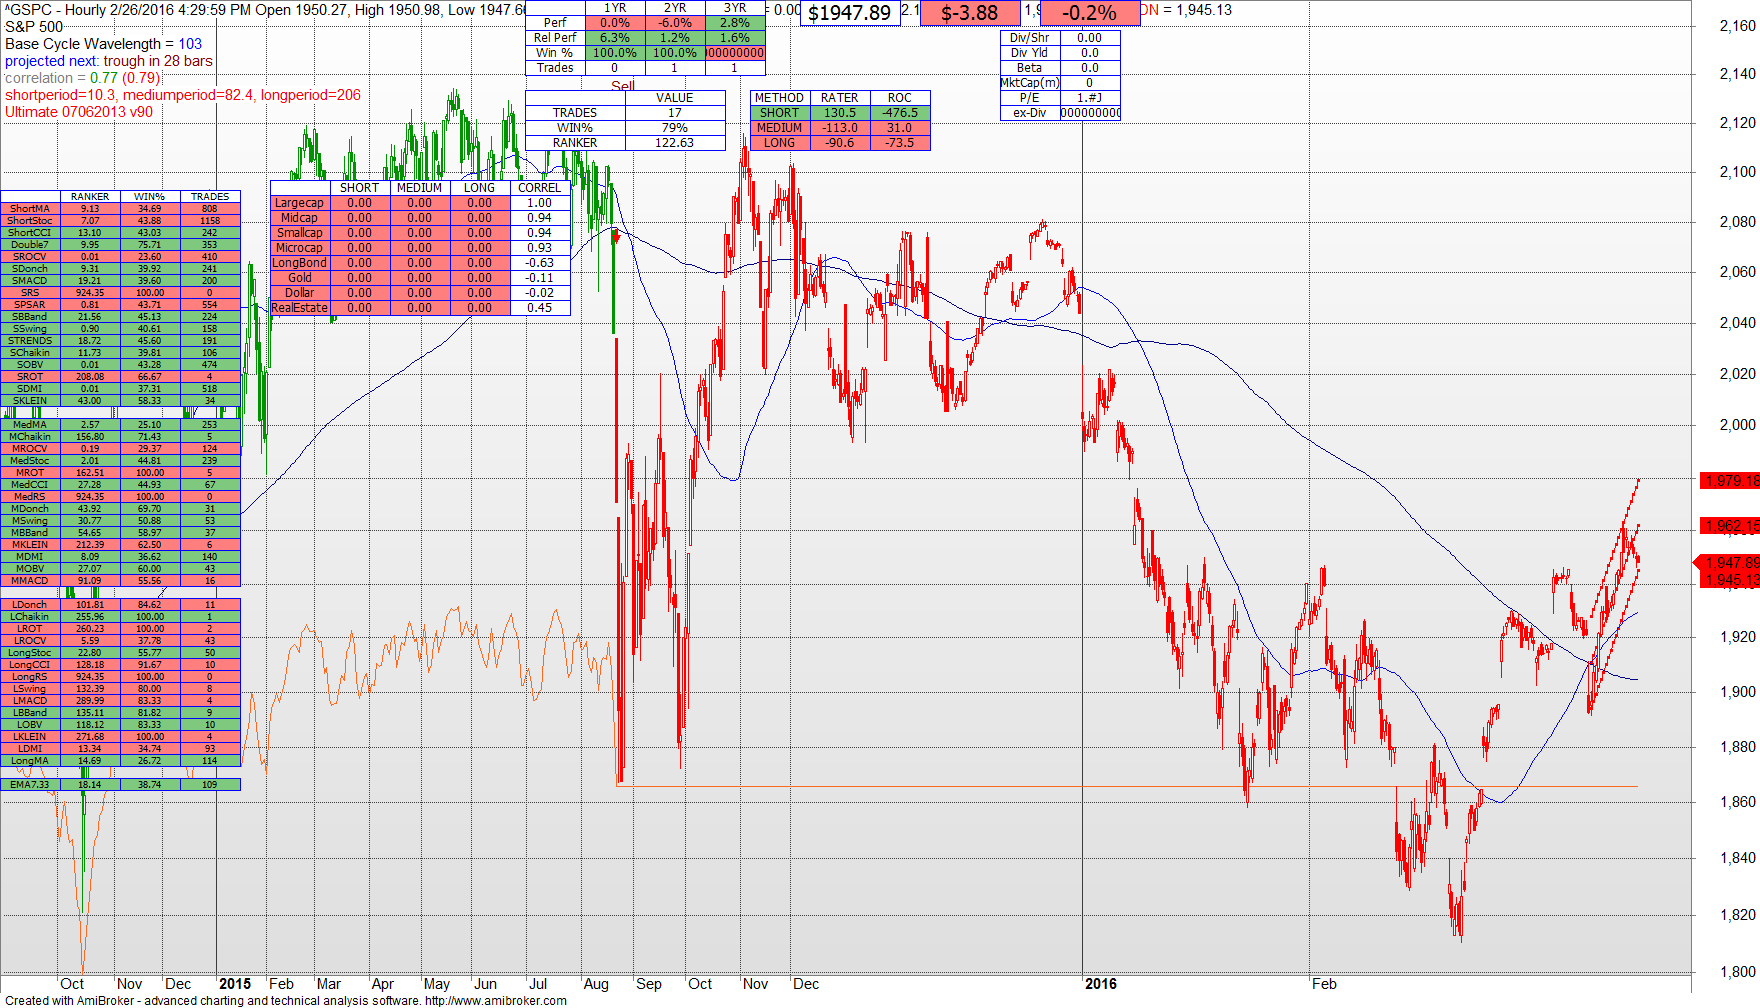
An Hourly view of the S&P reveals short term emerging strength.  The technical model is SELL in the hourly long term and intermediate term, but BUY in the near term hourly period.

02282016 GSPC H

I believe what we are seeing is a short-term upward movement in the market but in the context of a broader, long term downward market.

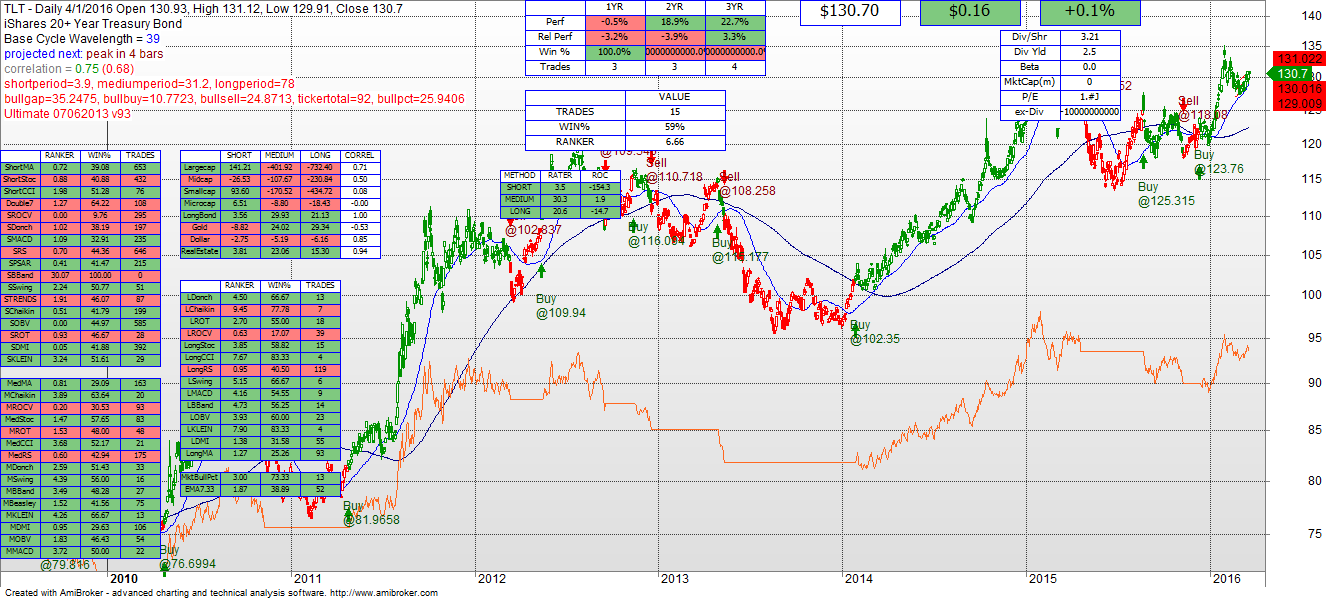
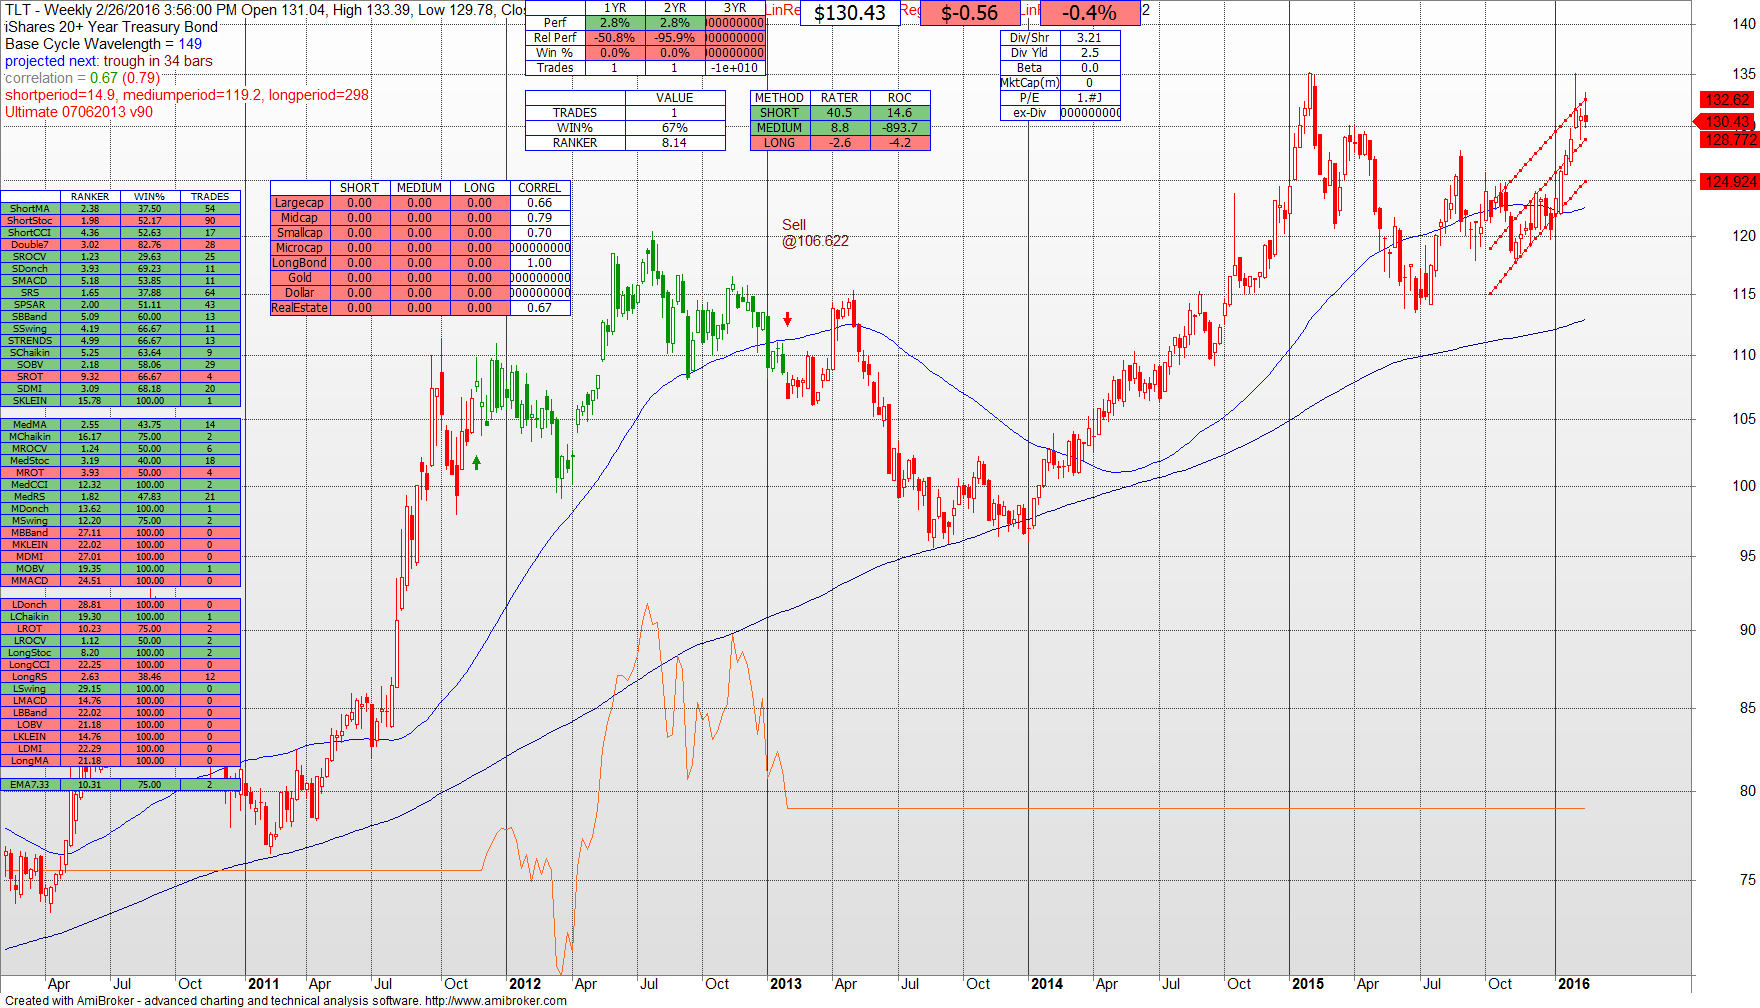
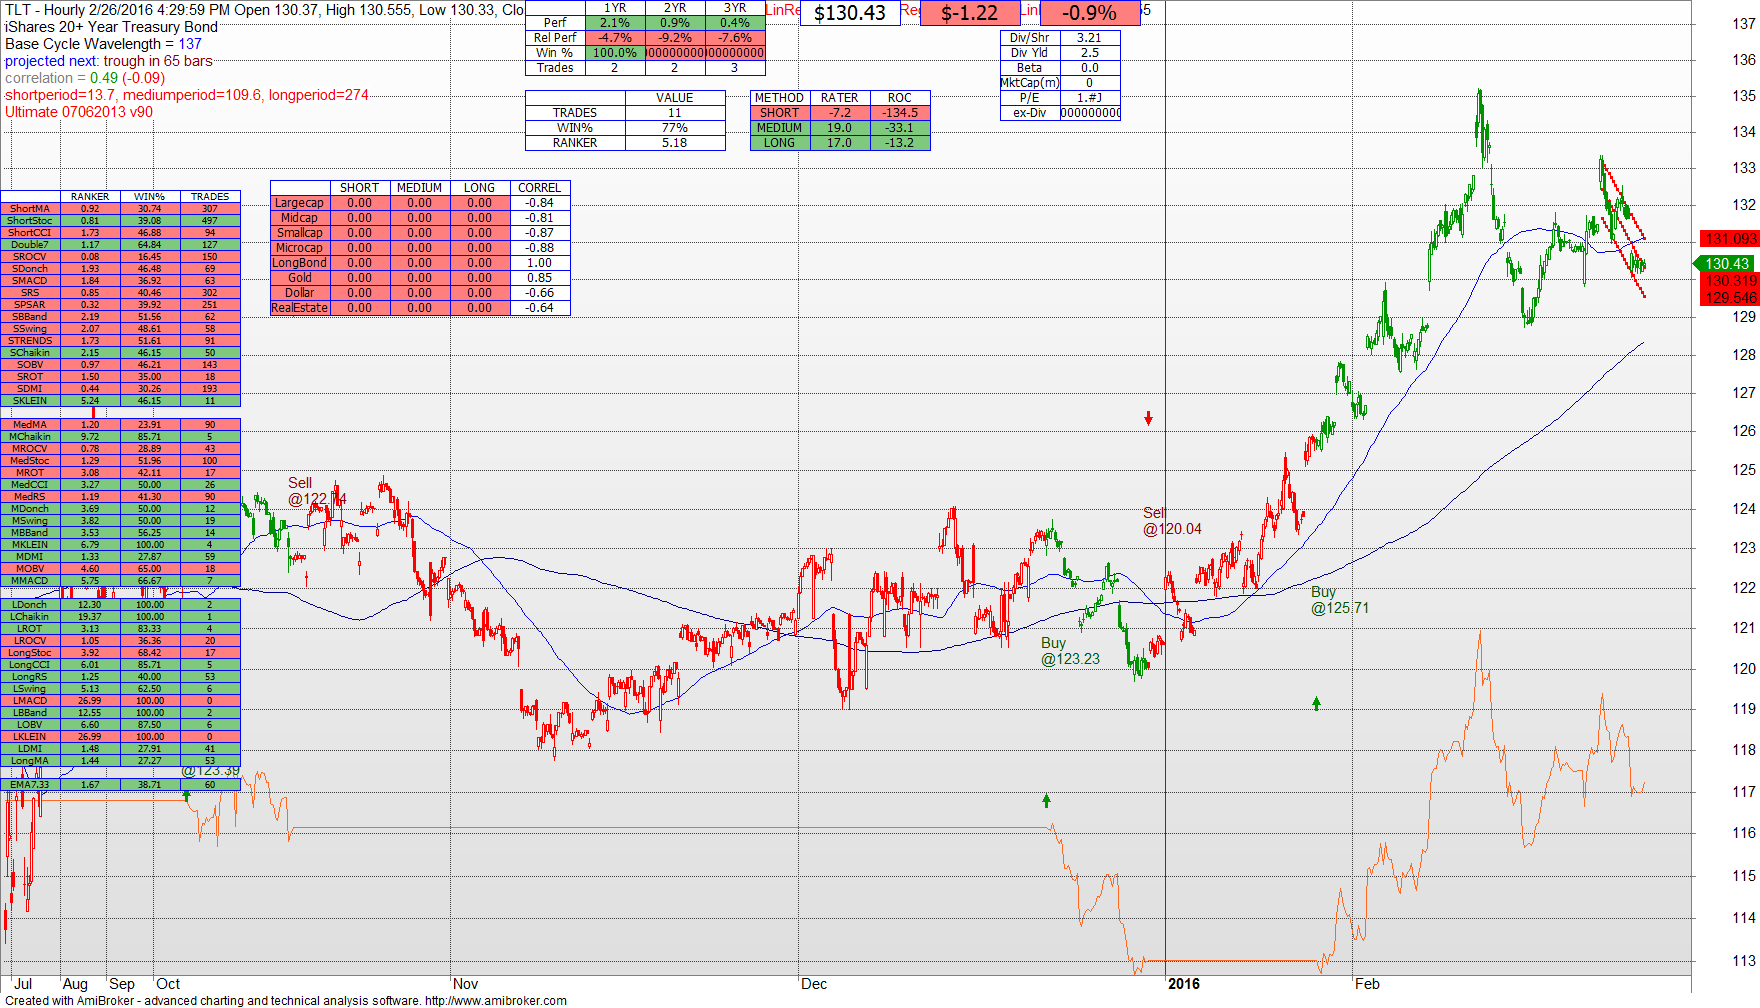
Turning attention to Bonds, the TLT ETF (Long Term Bonds) have been strong.  On a weekly basis going back to 2010 the technical model is BUY in short and medium terms particularly in the past 18 months.

02282016 TLT W


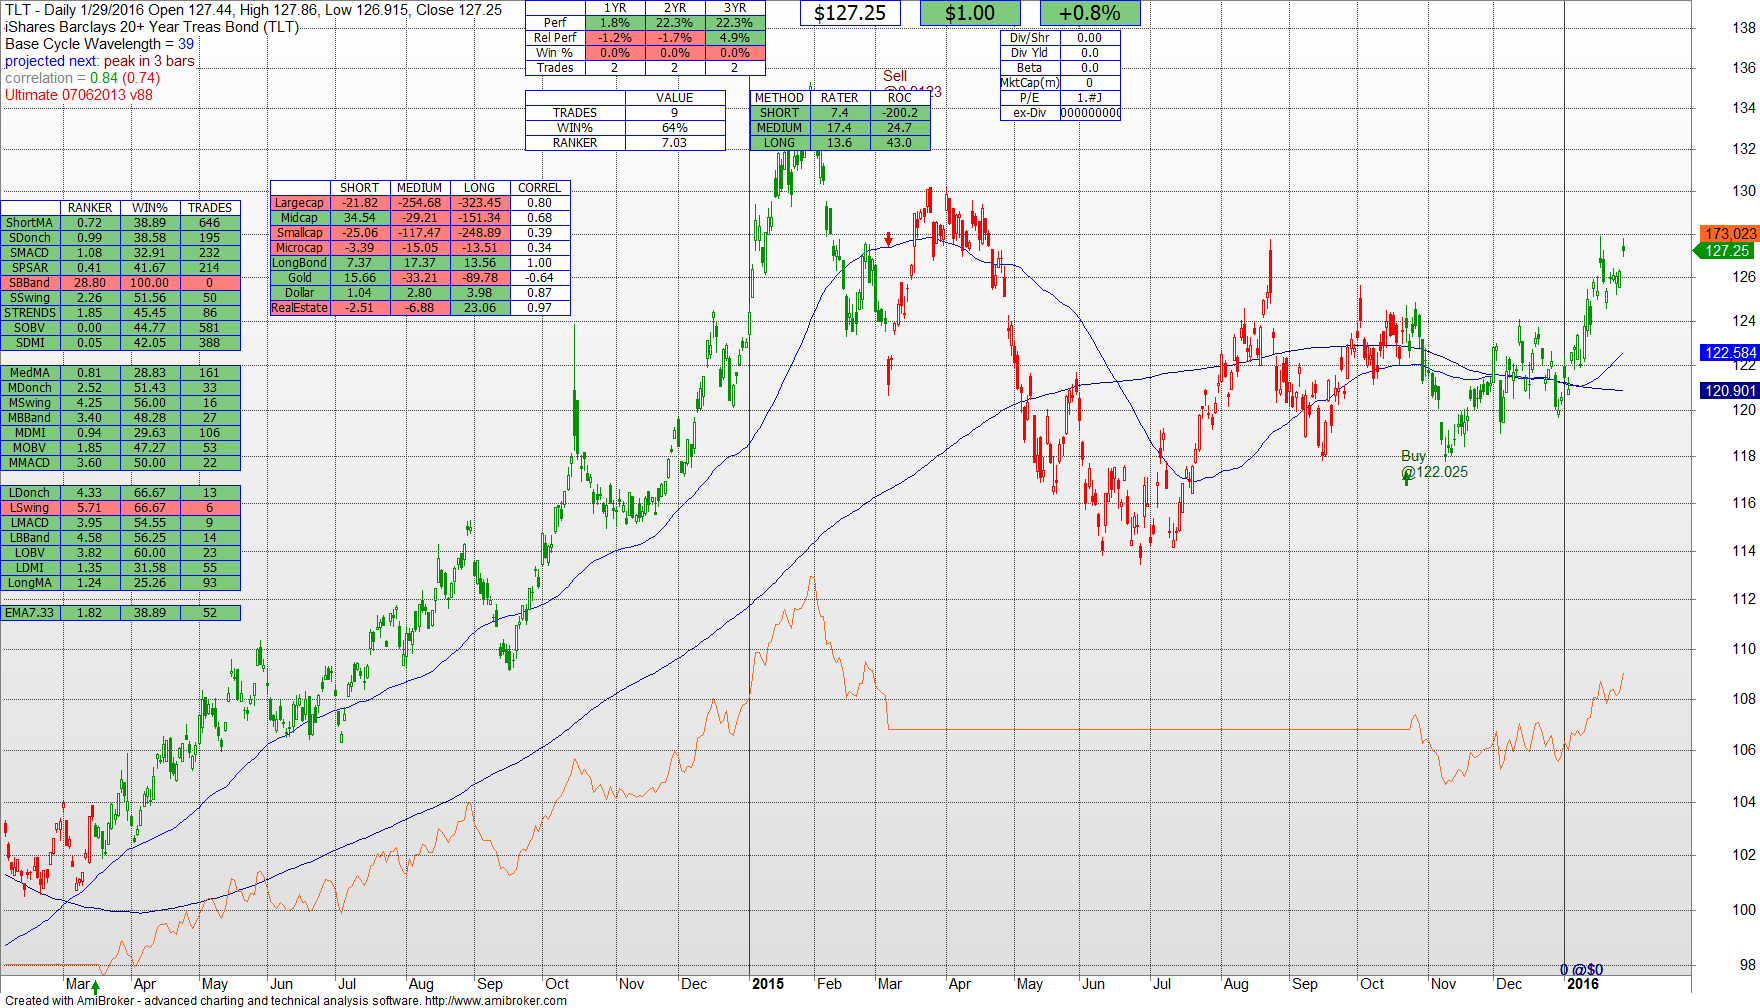
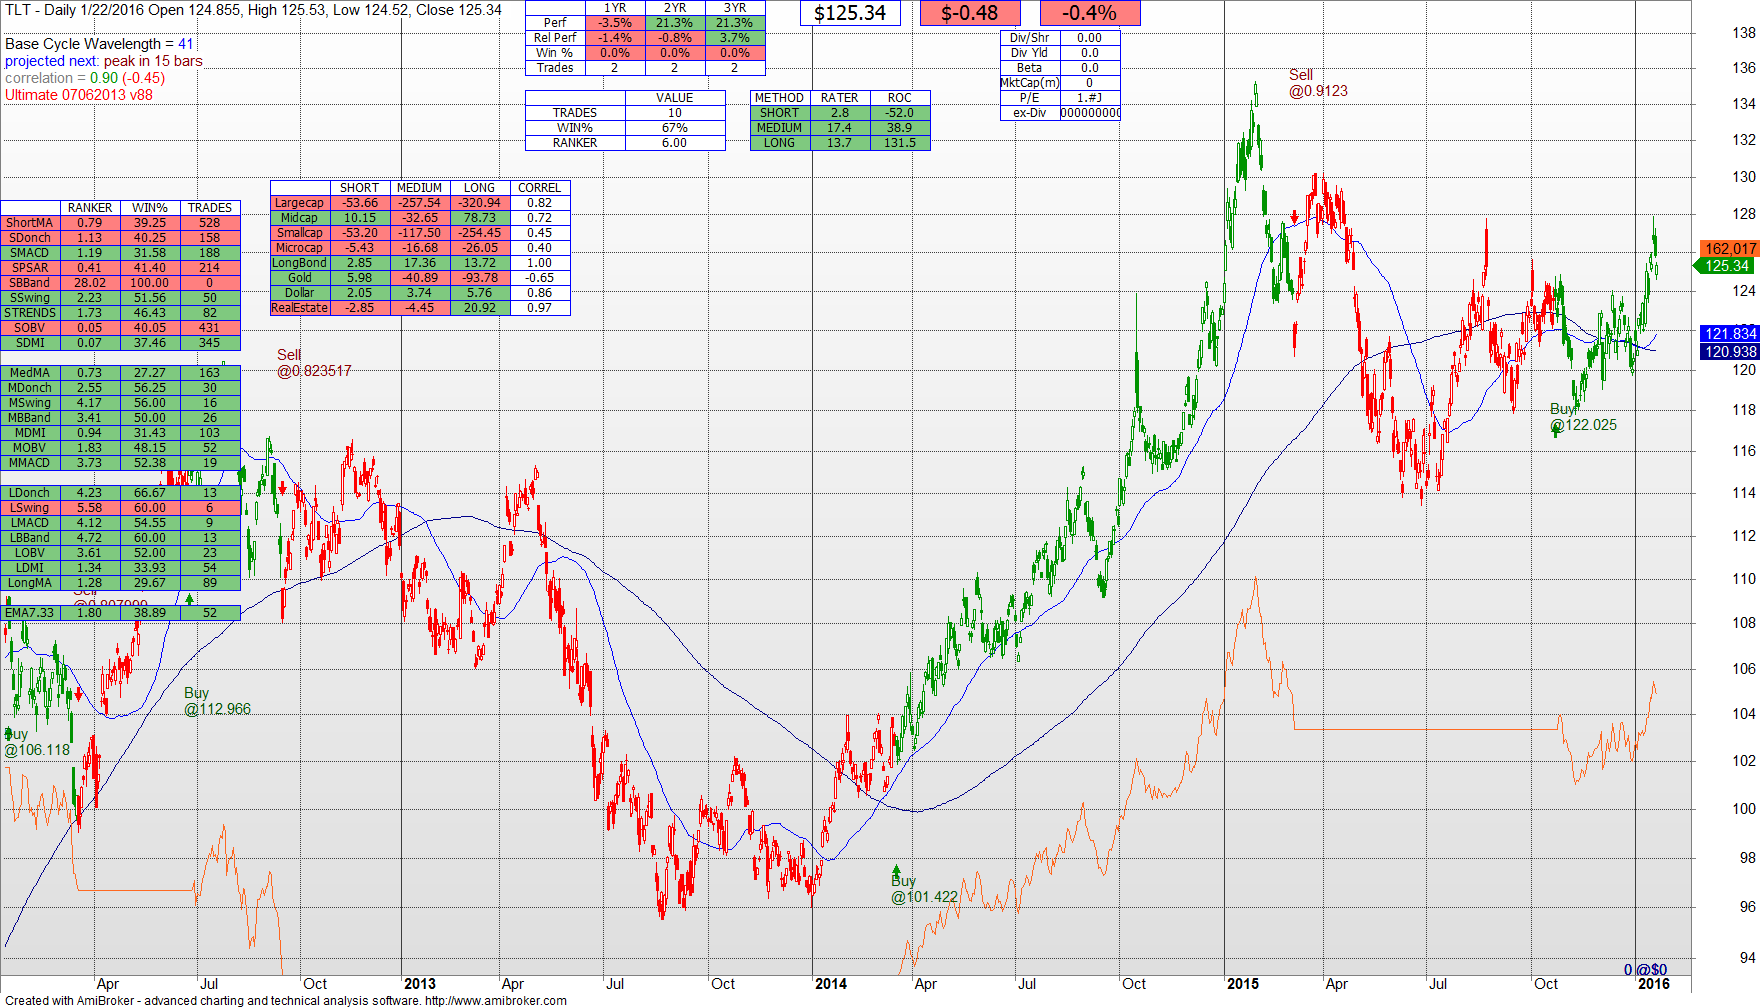
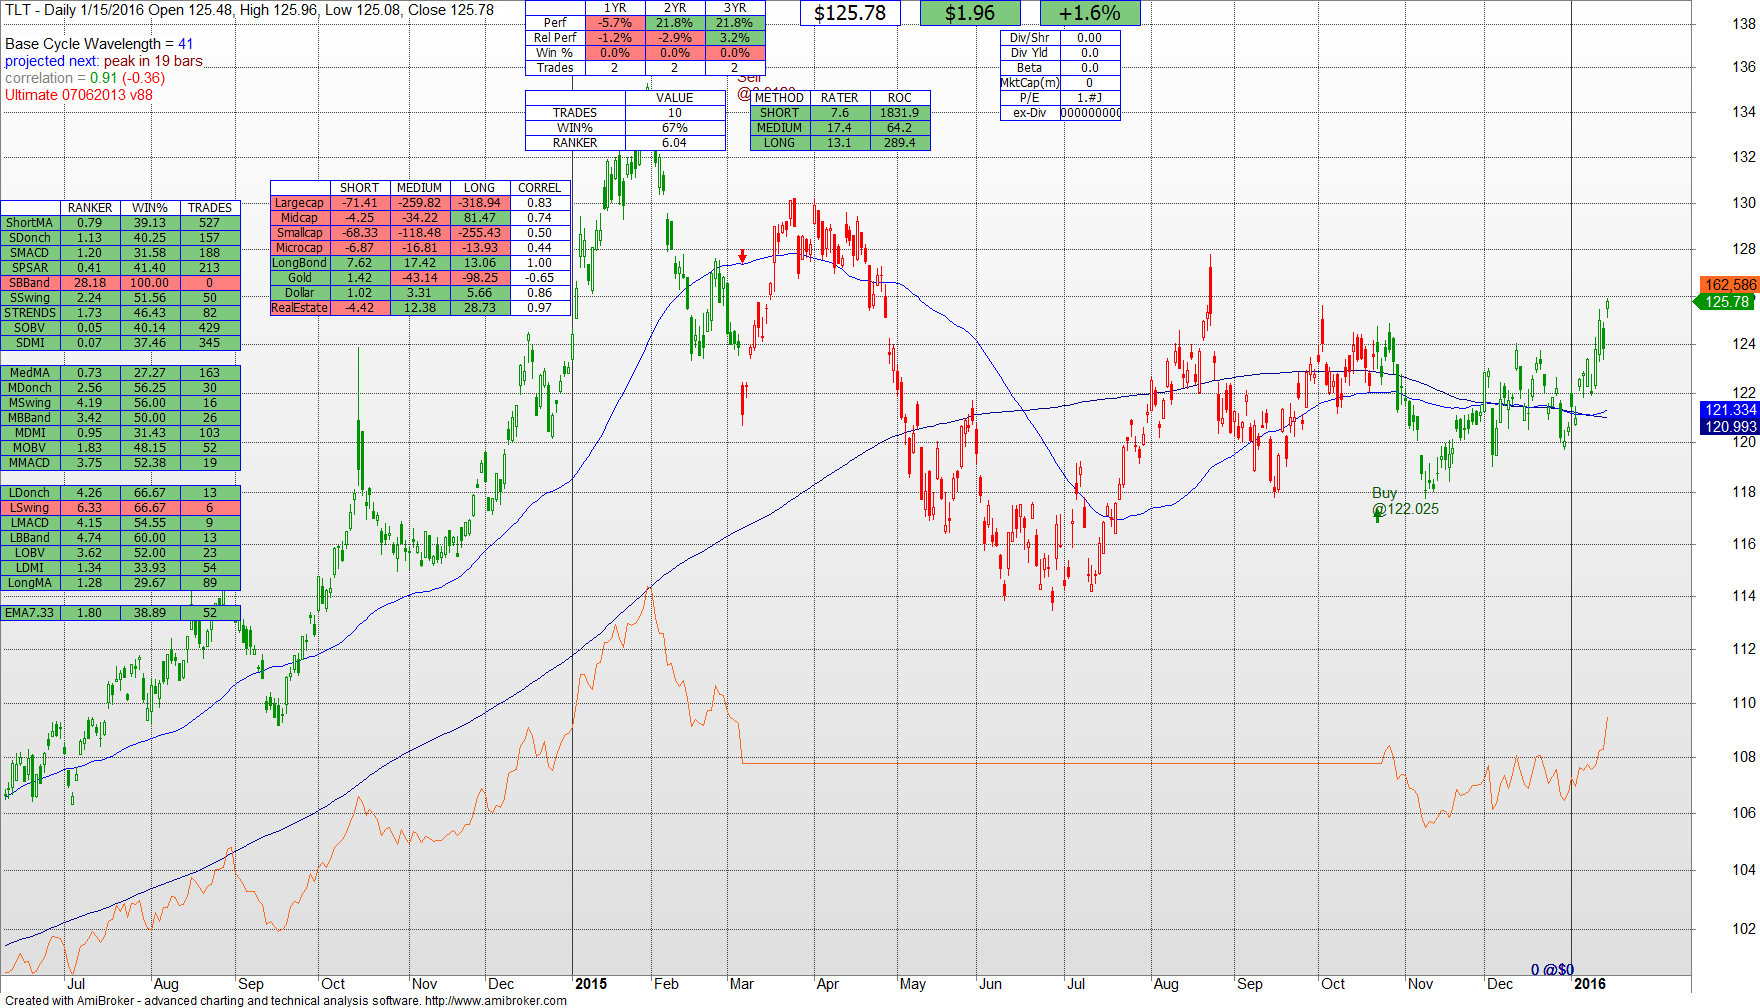
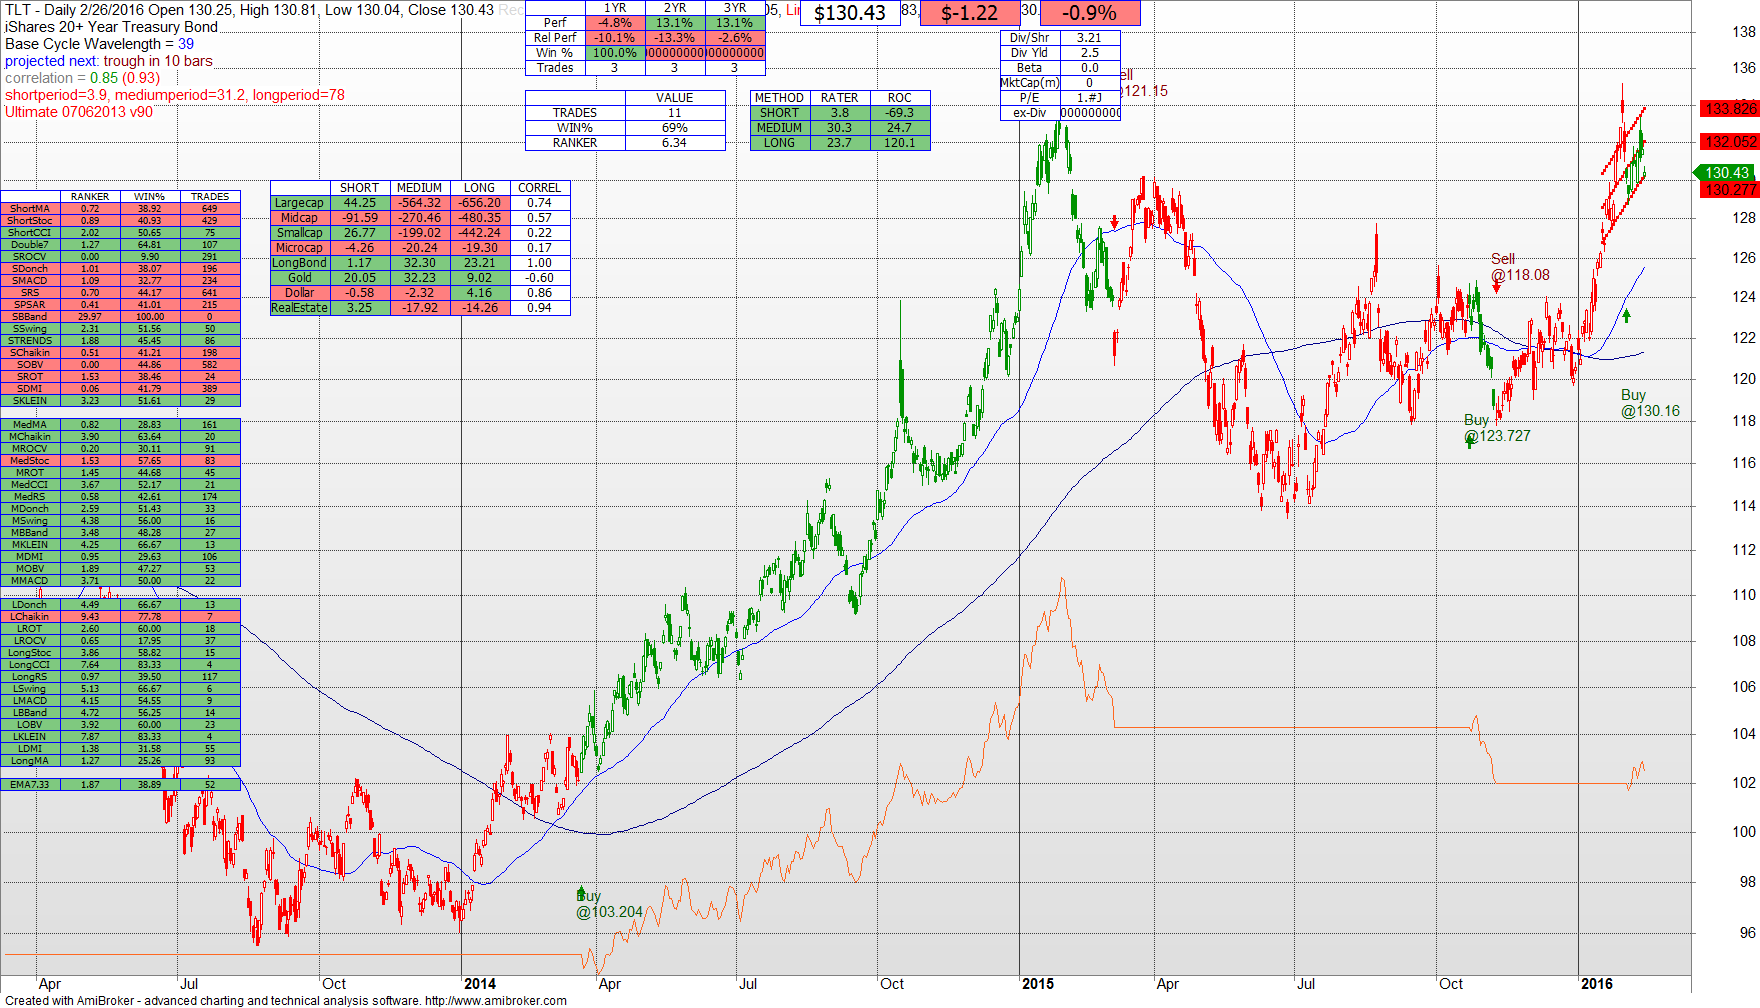
A Daily view of TLT reveals recent strength.  It is now BUY in all periods.  In some respects this is a confirmation of investor anxiety reflected in the high VIX and continuing concern about the market in general.  It is also a reflection of the belief that the Fed has no room to further raise rates with an economy that is weaker than the Administration is advertising.

02282016 TLT D


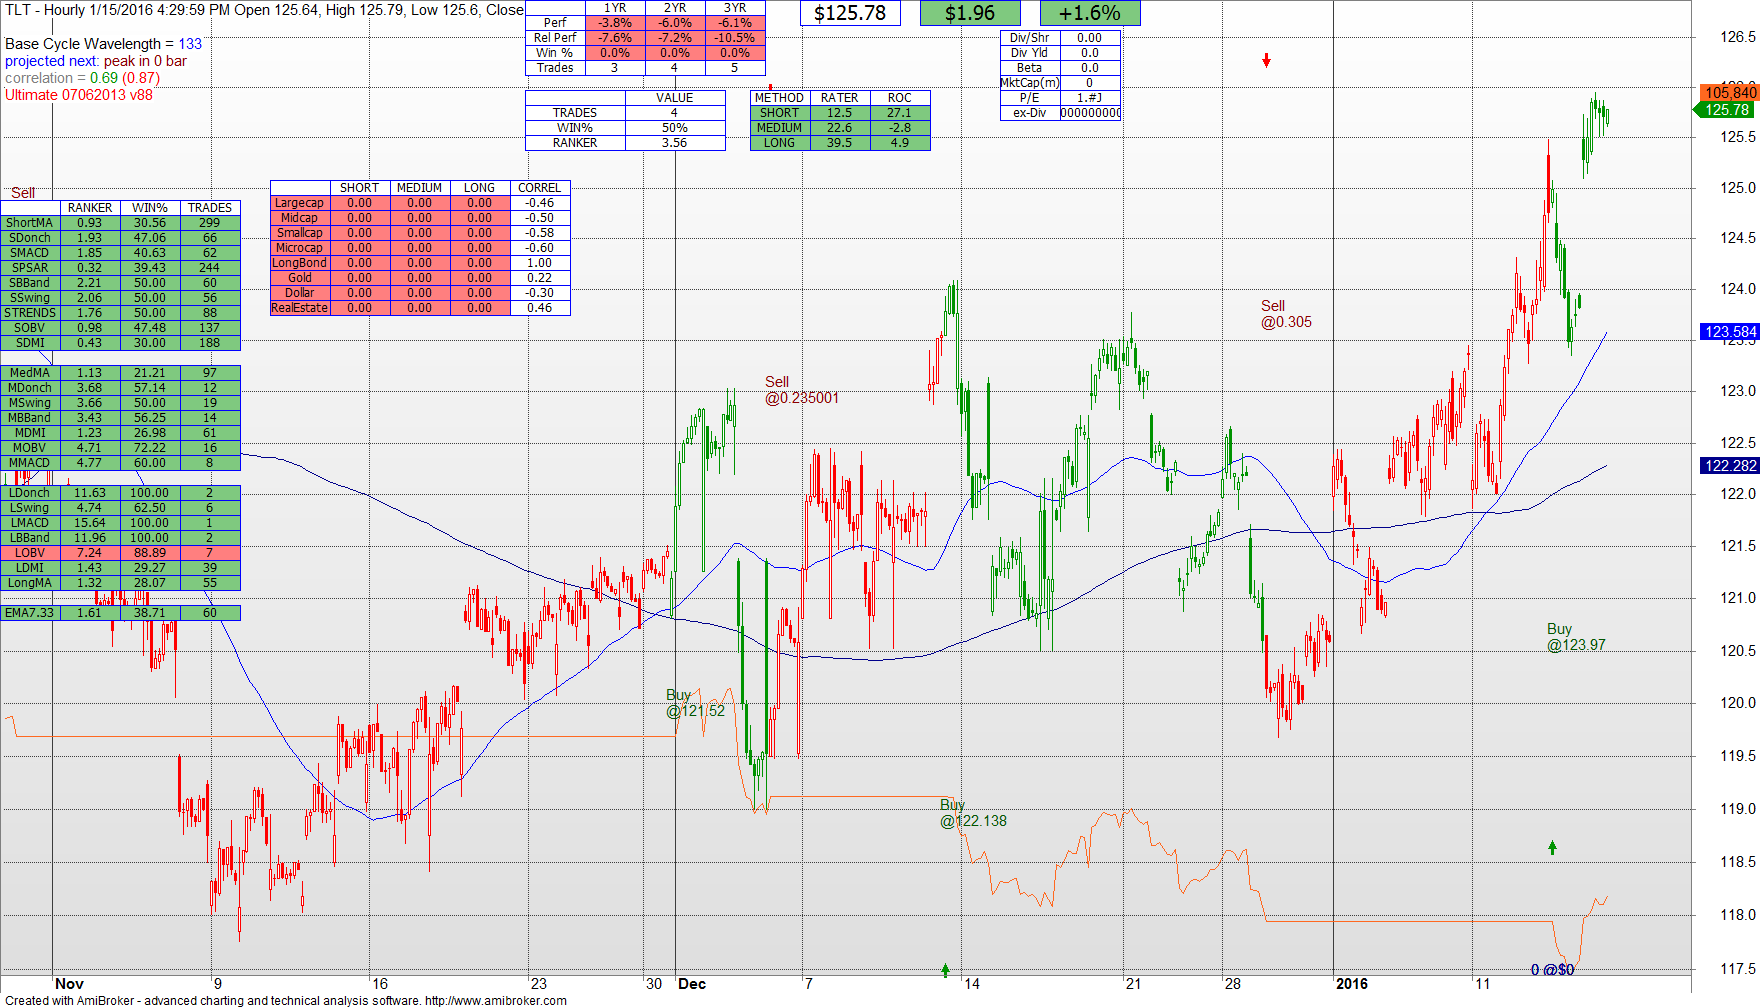
An Hourly view of TLT confirms the above.  TLT has been a BUY on the hourly chart since late January.

02282016 TLT H


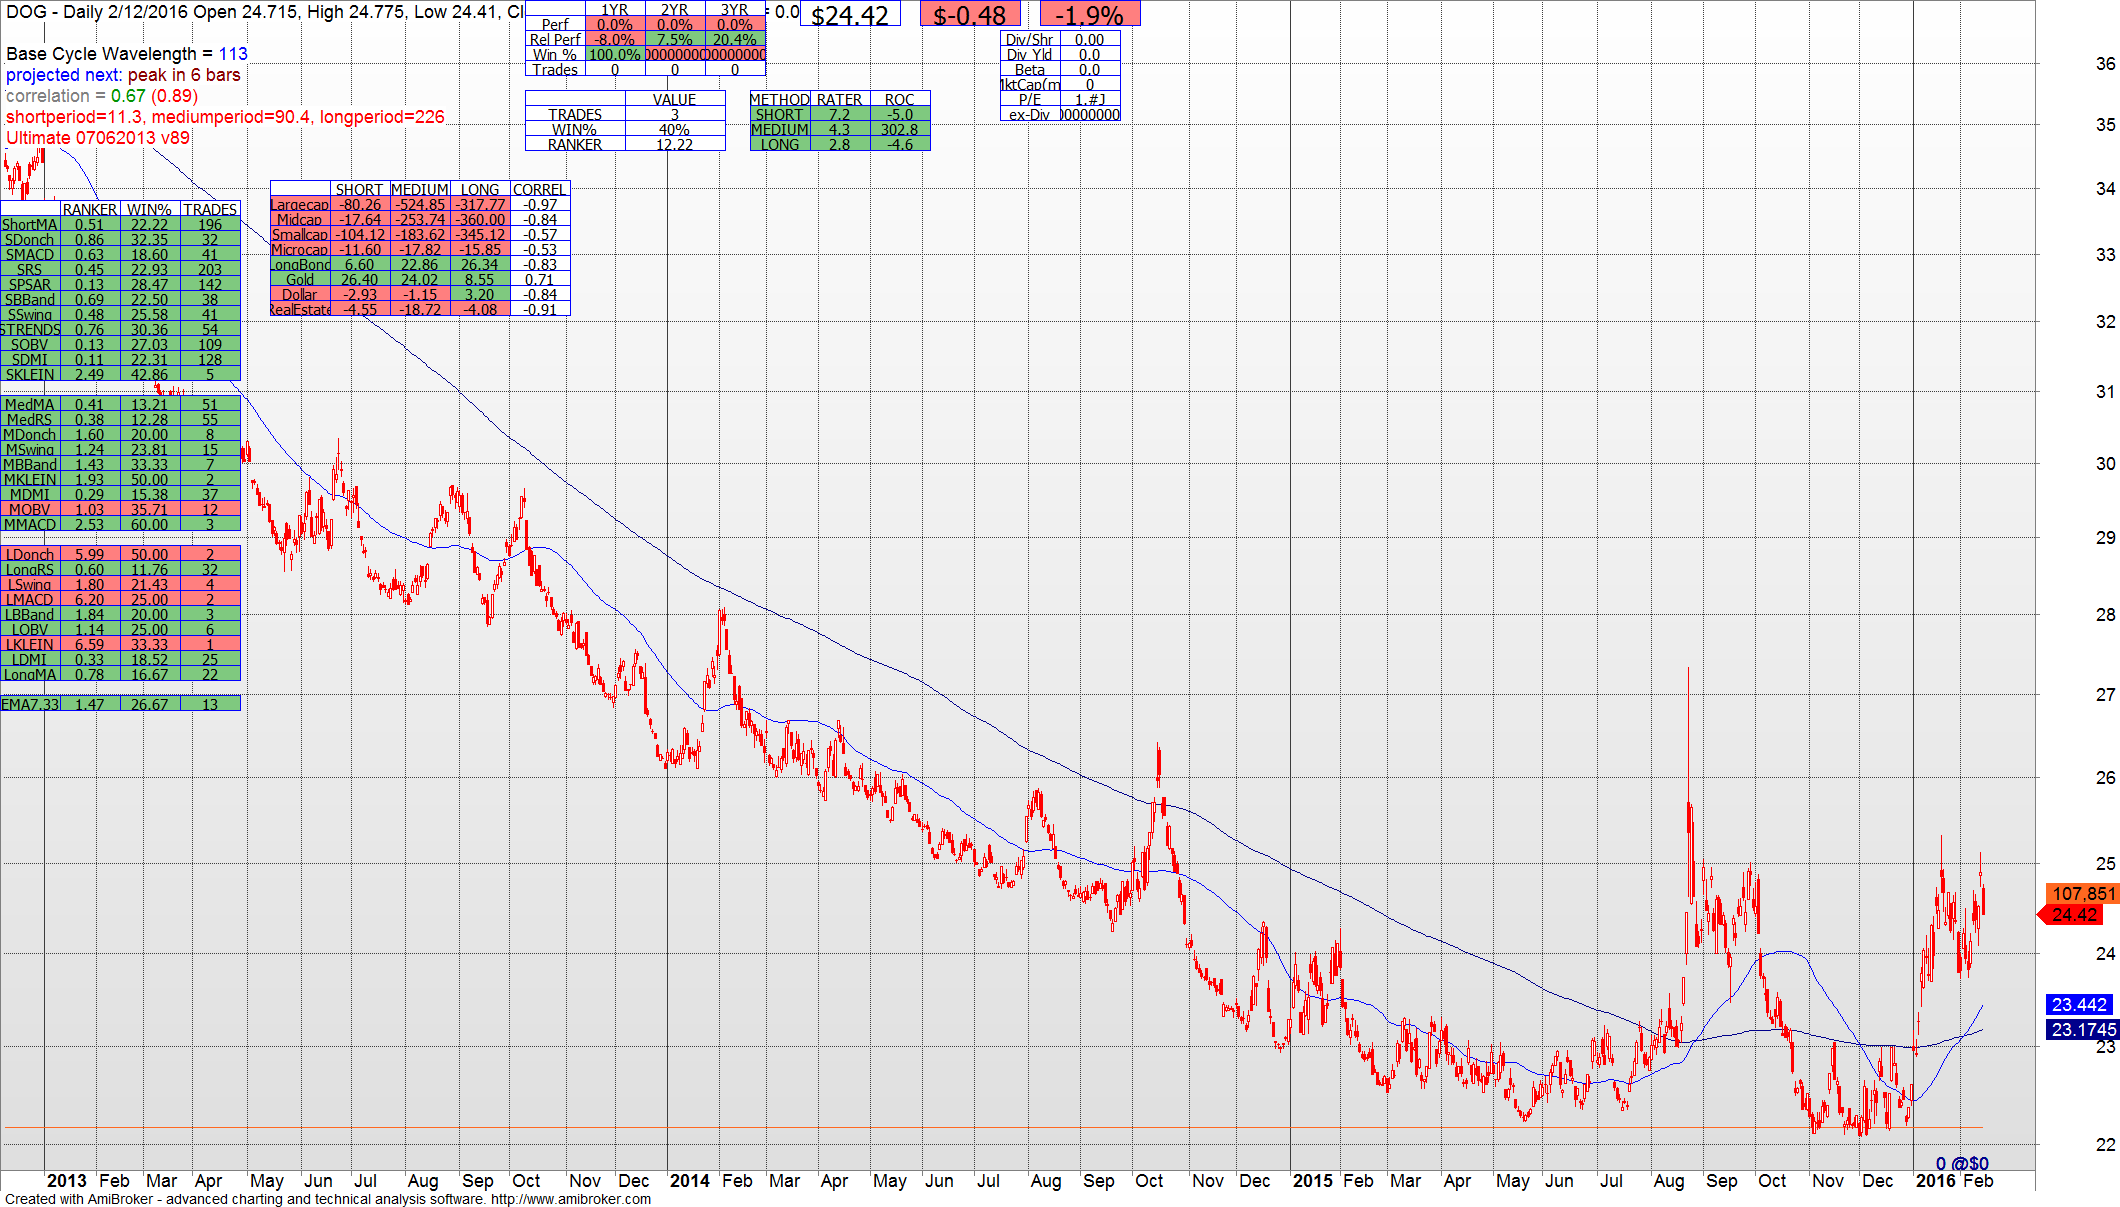
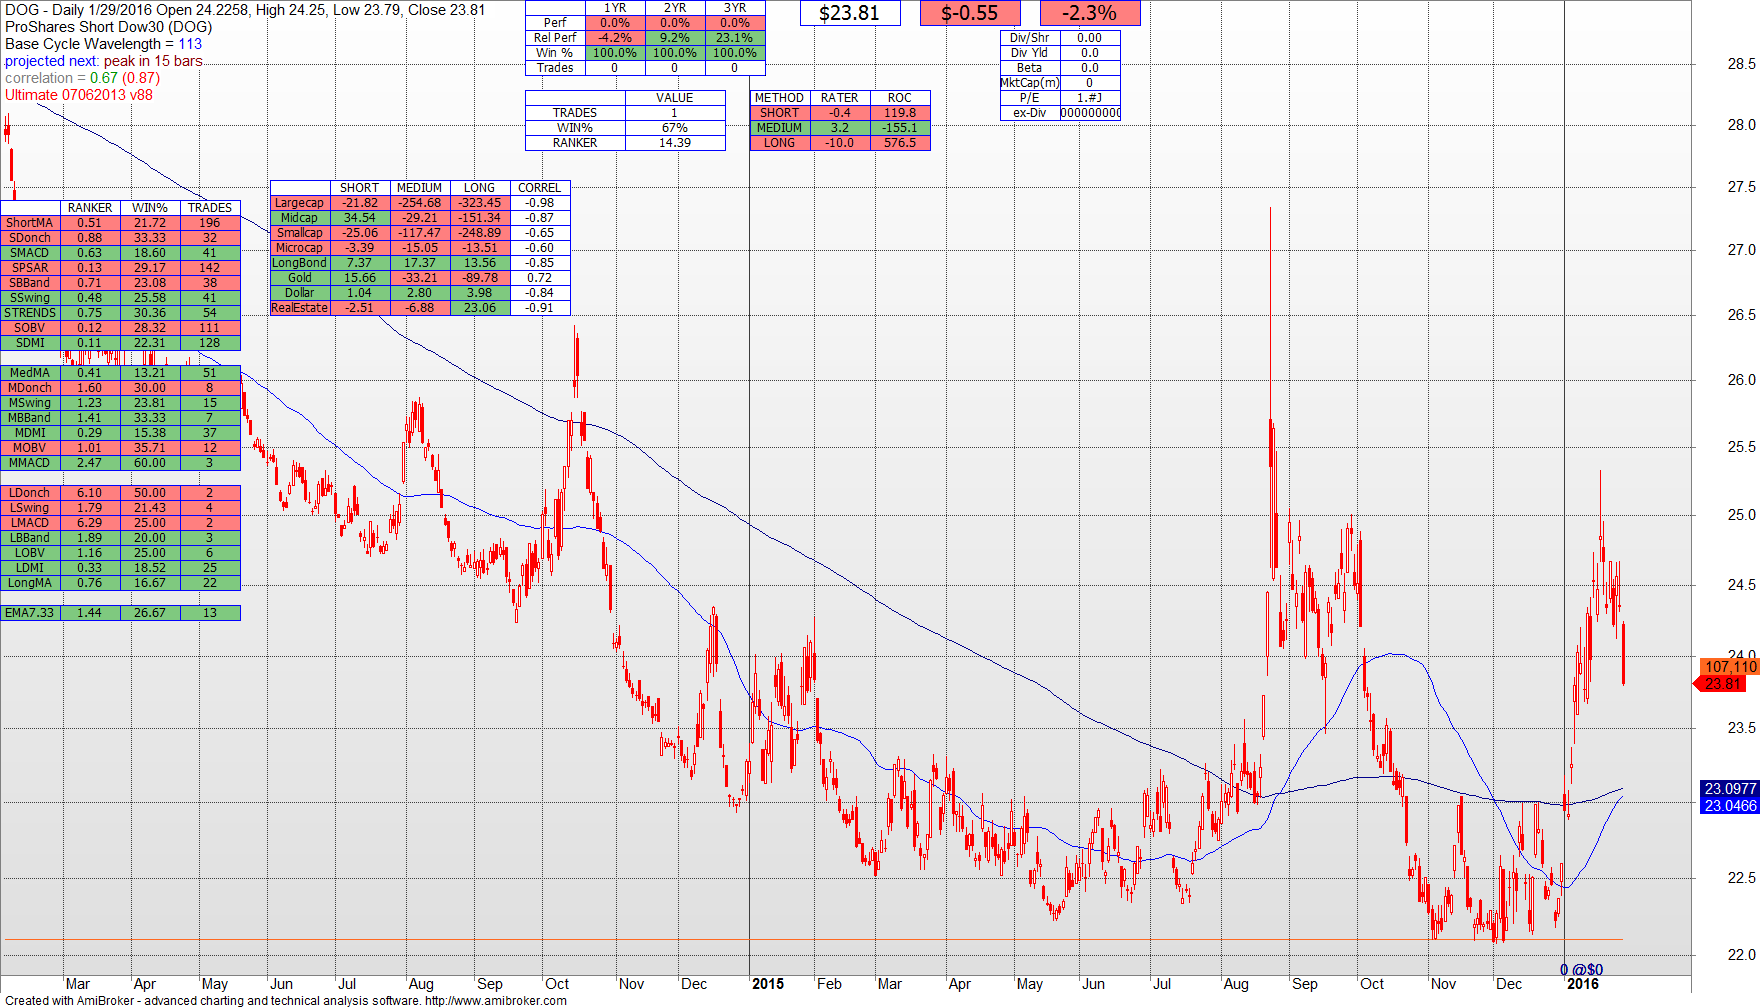
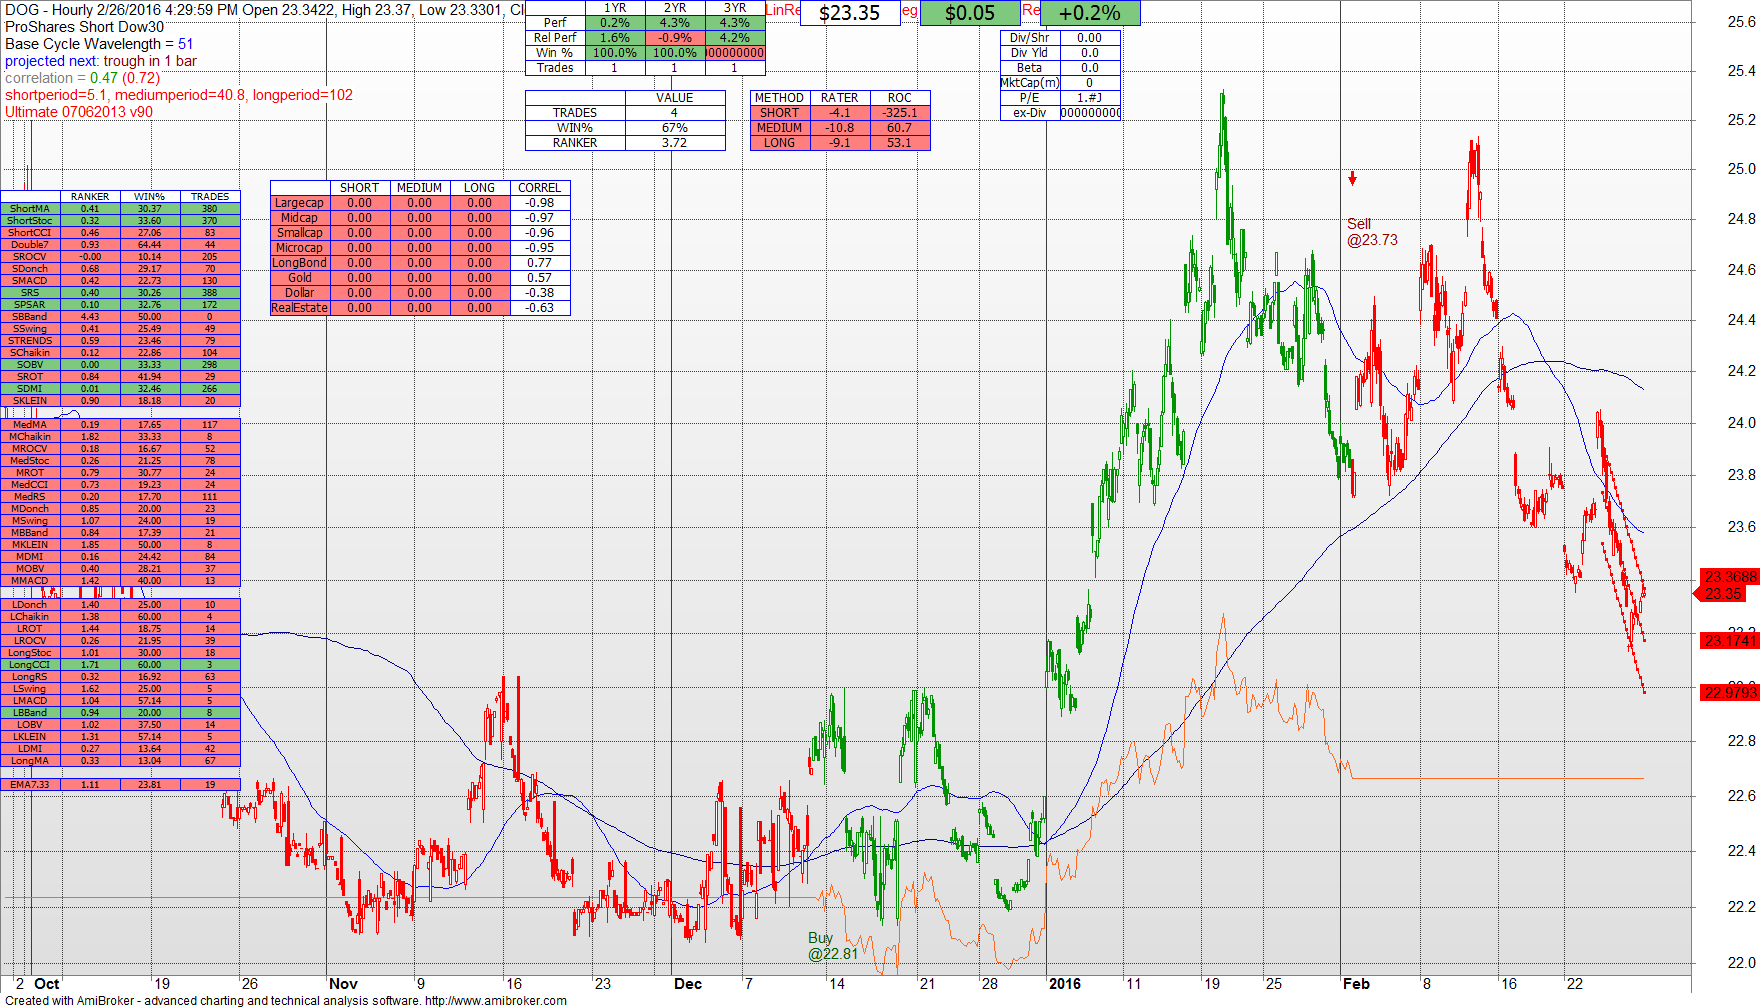
We are watching DOG, the inverse ETF, for an investing opportunity.  There was an opportunity for investing back in mid-December, but the opportunity expired with a profit at the end of January.  I will continue to keep you posted on the opportunity.
02282016 DOG H


Overall, the recommendation for intermediate term investors (not short term traders) is an 80% fixed income / 20% market equity allocation as we protect principal and wait for a trend in this market.

OTM Market Update – Reiteration

The advice from the January 17 post is still in effect.  As the S&P 500 toys with 1880 (it closed at 1853 today) you should prepare for a material drop if that 1880 level does not hold.  By now you should only have a small equity position.

As has been noted by others, there is an ominous piercing of the neckline of a head and shoulders setup in four different S&P 500 time frames, including daily and weekly.  This market may rise again beyond 1880 but as I said last month the risk/reward is simply not worth it.  If you have not yet positioned yourself for a material downside drop you should do so, with the idea that this market may climb again back above 1880 and even as high as 2040 but this chart looks like we are on our way down in the intermediate term.

The model is 6.1% ahead of the S&P500 in the trailing 12 months, 6.4% in the trailing 2 years, and 7.8% in the trailing 3 years.

The DOG S&P inverse ETF has not yet fired to a BUY, but for those interested in being aggressive it is BUY in the short and medium terms.  Note that this market may come back up to “kiss the trend line” before it fades so you may be early but you likely won’t be wrong.

02082016 GSPC

OTM Market Update – Preparing for a Trend to Emerge

As noted in prior posts the 1880 mark for the S&P (which is currently at 1940) has proven an important measure.  When 1880 holds there is always the likelihood that we might see another leg up in the market.  If 1880 fails there is almost certainly going to be a material collapse to the downside.

The S&P bounced off of 1880 and is now at 1940.  Intermediate and Long term indicators are still leading downward, and for that reason today I include a look at DOG, which is the S&P Inverse ETF.  While not yet a BUY it represents an opportunity to make money in a bear market for those Intermediate term investors whose assets are already properly allocated.  When DOG fires a BUY I will pass that along in an update.

The S&P was down 5.1% in January.  TLT (long bonds) were UP 5.5% in January not including the associated dividend income.  This again stresses the importance of asset allocation.  We continue to be about 80% Fixed / 20% Market as we wait for this relative volatility to pass and reveal a trend that intermediate term investors can capitalize upon.

01312016 DOG

01312016 GSPC 01312016 TLT 01312016 GSPC hourly

Miley Fundamental Update

Dear Friends,

Again, I apologize for not updating this portfolio more often.  I promise to do better.  I have dumped nearly all of the former stocks (for example, I dropped DST at 112 a few months ago).  But I am retaining AAPL, CELG, ORLY, and SKWS and adding 5 new picks.  Here is a round up of my thoughts:

  • Apple – I am maintaining my position in this one.  I believe that Apple is still a great pick, even if earnings only grow at an anemic rate of 6%, the stock is still undervalued and should be at least 128.
  • Celgene – Even with the recent bad news, I still think Celgene is undervalued and should sell for 116, a significant upturn from its current price.  Don’t expect instant gratification but I advise staying with them.
  • O’Reilly Automotive – I am maintaining my position in this one.  It is fairly valued at these levels so I wouldn’t buy more.
  • Skyworks Solutions – This stock has been pummeled along with Apple.  But I think it is still undervalued and should be accumulated.
  • United Therapeutics Corp (UTHR) – United Therapeutics Corp is a biotechnology company.   The company is engaged in the development and commercialization of products to address the unmet medical needs of patients with chronic and life-threatening conditions.  This stock is my top pick.  With an ROE of 49% and expected growth north of 22%, I think that this one will be 200 by this time next year.
  • Avago Technologies (AVGO) – Avago Technologies Ltd is a designer, developer and supplier of semiconductor devices with a focus on analog III-V based products and complex digital and mixed signal complementary metal oxide semiconductor, or CMOS, based devices.  With an ROE of 35% and expected growth of 26%, I see this stock reaching 141  (it currently sells for about 126).
  • Taiwan Semiconductor (TSM) – Taiwan Semiconductor Manufacturing Co Ltd engages in the manufacturing, selling, packaging, testing and computer-aided design of integrated circuits and other semiconductor devices; it also manufactures masks.  With an ROE of 30% and expected growth of 15% I see this stock reaching 41 from its current level of 21.
  • Gentherm, Inc. (THRM) – Gentherm, Inc. is engaged in the design, development, and manufacturing of thermal management technologies. The Company has two reportable segments for financial reporting purposes: Automotive and Industrial.  With an ROE of 27% and expected growth of 25%, I see this stock reaching 100 from its current level of about 39.
  • Maximus, Inc. (MMS) – Maximus Inc provides business process services to government health and human services agencies in the United States and to foreign governments.  With an ROE of 27% and expected growth of 19%, I see this stock reaching 64 in a year from its current level of about 52.
  • read more

    OTM Market Update – Still a Dangerous Market

    Despite the 1.4% increase in the S&P500 index last week there is no reason to believe that this market is changing its tone.  The attached technical charts still are negative for the S&P, including now a SELL signal on the S&P weekly.

    As an intermediate term investor (and not day trader) you should use your asset allocation to protect yourself.  As noted in previous posts I am 80% cash and short term fixed income.  The number of true opportunities where your upside/downside risk ratio is better than 2.0 is very limited right now.  There are times when being in the market is too risky for the potential reward.  This is one of those times.

    01242016 tlt 01242016 gspc 5min 01242016 gspc weekly 01242016 gspc

    OTM Market Update – 1880 is here – Reality Check

    Last week I wrote that you should keep an eye on the S&P for a fall to 1880.  We are here.

    The market is oversold in the short term.  You should fade the increases by selling into them to further lighten your equity position.  The downside risk is far higher than the potentially missed upside opportunity.

    Often the market will give back 50% of its gain even on its way up.  That puts the S&P at 1601.  Even if it just gave back 38% of its gain it would drop to 1724 (a fibonacci retracement).

    Lighten your equities this week.  Inverse ETFs like DOG have not yet fired in the technical model but should soon.

    Even if this market goes back up it will need much much more volume, buying power, and economic news to build a further leg up.

    01172016 TLT daily 01172016 TLT hourly 01172016 GSPC hourly 01172106 GSPC