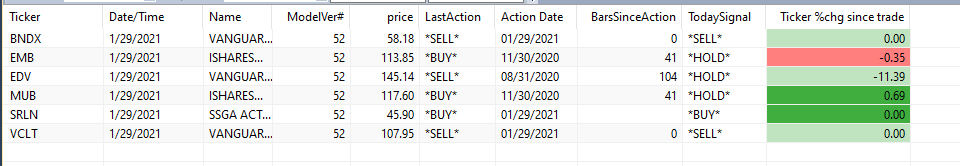
V45.2 Profitability

This is the profitability by ETF from the latest iteration (v45.2) of the model trades from a page in a customized Power BI (PBI) version of Portfolio Slicer (PS). Trades from the model are loaded into the PS Excel workbook using some semi-automation we have developed.

Shown is overall profitability based upon trading the ETF (Sales Capital Gain), Dividends and Unrealized Capital Gains for those ETF’s currently being held. Dividends are from Yahoo using the external date scripts available as part of PS.

A comparison to previous iterations will be posted shortly. read more

version 45 results

Version 45 results.
In this version I cut the investment amount per trade to 10% of its prior value, which allowed all trades that could happen to happen. In this way one can see which ETFs would trade regardless of order, since overall exposure is now not quite 30% since there is plenty of cash even with repeated scaleIn and scaleOut operations. RAR is 7.48%, which is indicative of the non-reliance at this point on RSI. read more

version 45 economic notes

Version 45 trades version 2

I revised the economic indicators for accuracy. The RAR increased to 9.82% with 82% exposure. MDD is -16.23%, relatively unchanged. Two open Bond positions with BNDX and MUB.

Economic Interpretation is 6-3 in favor of indicating that we are in an expansion period, as follows:

Version45
Phase 1: Expansion leaving Trough
Phase 2: Expansion approaching Peak
Phase 3: Contraction leaving Peak
Phase 4: Contraction approaching Trough

DGS3MO 90-day Treasury Indicator
DGS3MOprice=0.1
Phase Prediction=1

DBC COMMODITY INDICATOR
DBC price=15.3
Phase Prediction=2

SPY BROAD MARKET INDICATOR
SPY price=375.7
Phase Prediction=2

UNRATE BROAD MARKET INDICATOR
SPY price=6.7
Phase Prediction=2

HOUST HOUSING STARTS CONFIRMATION
HOUST price=1547
Phase Prediction=3

VIXCLS CBOE Volatility Indicator
Phase Prediction=3

CP CORPORATE PROFITS CONFIRMATION
CP price=2118.86
Phase Prediction=3

TWEXM US DOLLAR INDICATOR
TWEXM price=91.5077
Phase Prediction=2

XLU UTILITIES INDICATED PHASE
XLU price=62.99
Phase Prediction=1

Phase Predictor Indicator
Phase 1 Total = 2
Phase 2 Total = 4
Phase 3 Total = 3
Phase 4 Total = 0

Expansion Ind = 1 Contraction Ind = 0 read more

economic summary 1/17/2021

Economic Summary 1/17/2021

In the lower part of the chart below you can see that the difference between Phase 1&2 (expansion) and Phase 3&4 (Contraction) remains high at 4. You can also get to that math by adding the Phase 1 and 2 totals from the count below and subtracting Phase 3 & 4. Historically that bias of 4 is high. It presumes that the risk of investing in assets that are correlated to the economy is low at this point.

The model is invested in two Bond funds (MUB, BNDX) but also in commodities (PDBC), and as long as the correlation between bonds and the overall market remains positive I suspect that the algorithm will not change its opinion.

Phase Predictor Indicator
Phase 1 Total = 2
Phase 2 Total = 4
Phase 3 Total = 3
Phase 4 Total = 0 read more

Collaboration

This site is designed to allow collaboration among people who are managing or intending to manage their retirement investments themselves.

The important elements of retirement investing are covered including stock/ETF selection, asset allocation, rebalancing, BUY/SELL timing. What is out of scope is retirement budgeting, expense management, and other financial planning topics such as estate planning.

One of the elements of the site is a monthly strategy that is designed to provide low risk return with a predictable income stream. This strategy is grounded in technical investing theory as well as economic theory. It is designed to be reviewed and managed on a monthly basis.

Review the various postings on the site at your leisure. And “follow” topics of interest to get emails as updates are created. read more

portfolio slicer

I use this software to give me an aggregate look at the overall investment status on a daily basis by bucket.  It is free, and uses Excel and Power BI as its toolset so it will be around a while, and my data stays local on my machine.

Not sure I mentioned it before.

I updated the Power BI view to also give me a stock chart, so I can run this daily to update the quotes (free) and look at both allocations and individual stock prices.

Probably been using it for 3 years give or take.  Replaced Quicken with it.  Also just to humor myself I loaded every stock trade I made over the past 15 years so I can see some aggregate data.

http://www.portfolioslicer.com/ read more

bucket strategy

The emerging approach uses a “Bucket Strategy”. Basically, Bucket #1 is Cash, Bucket #2 is Fixed Income, Bucket #3 is Income producing Equities, and Bucket #4 are capital gains focused Equities. On an annual basis, the income from Buckets #2 and #3 refresh Bucket #1, and we use Bucket #4 to capitalize on long term market gains.

This approach has been described in an article by Morningstar. We are modifying the approach slightly to include an additional bucket.

https://www.morningstar.com/articles/840177/the-bucket-approach-to-retirement-allocation read more

george dagnino

Our analytic approach is designed to link technical investing techniques with economic data. This is described in many of the presentations by George Dagnino. We are attempting to automate this approach using the Amibroker trading software for convenience.

Dagnino’s books that we are baking into this analysis include “Easy Ways to Beat the Market with ETFs” and “Profiting in Bull or Bear Markets”.

https://www.peterdag.com/ read more