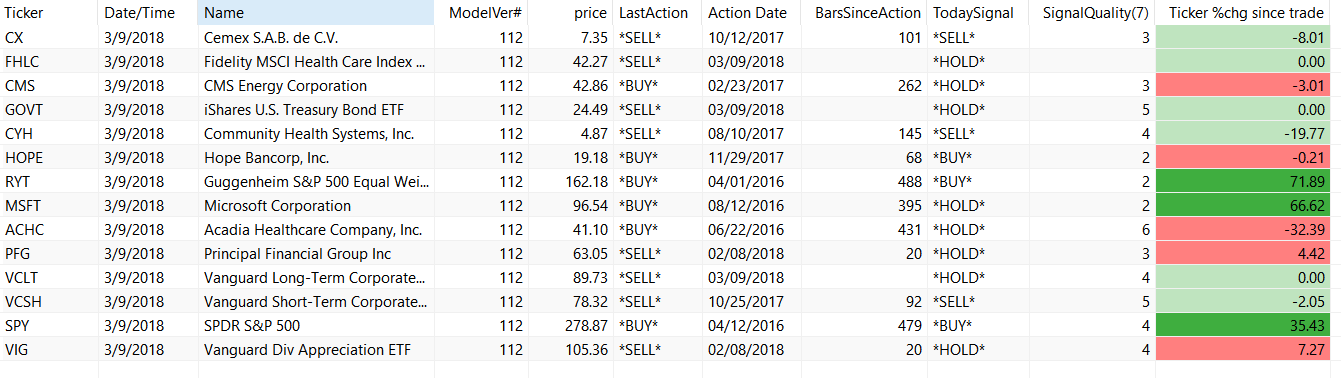
Some tickers with status based on model current version 112.

https://onthemarkinvesting.com/wp-OTMcontent/uploads/2018/03/Capture.png
Conservative. Smart. Investing.
I use this software to give me an aggregate look at the overall investment status on a daily basis by bucket. It is free, and uses Excel and Power BI as its toolset so it will be around a while, and my data stays local on my machine.
Not sure I mentioned it before.
I updated the Power BI view to also give me a stock chart, so I can run this daily to update the quotes (free) and look at both allocations and individual stock prices.
Probably been using it for 3 years give or take. Replaced Quicken with it. Also just to humor myself I loaded every stock trade I made over the past 15 years so I can see some aggregate data.
http://www.portfolioslicer.com/
It varies.
Corporate Profits: Quarterly on first day of quarter
90 Day Treasury: Daily
Housing Starts: Monthly on first day of month
Dollar: Weekly on first day of month
Unemployment Rate: Monthly on first day of month
The emerging approach uses a “Bucket Strategy”. Basically, Bucket #1 is Cash, Bucket #2 is Fixed Income, Bucket #3 is Income producing Equities, and Bucket #4 are capital gains focused Equities. On an annual basis, the income from Buckets #2 and #3 refresh Bucket #1, and we use Bucket #4 to capitalize on long term market gains.
This approach has been described in an article by Morningstar. We are modifying the approach slightly to include an additional bucket.
https://www.morningstar.com/articles/840177/the-bucket-approach-to-retirement-allocation
Our analytic approach is designed to link technical investing techniques with economic data. This is described in many of the presentations by George Dagnino. We are attempting to automate this approach using the Amibroker trading software for convenience.
Dagnino’s books that we are baking into this analysis include “Easy Ways to Beat the Market with ETFs” and “Profiting in Bull or Bear Markets”.
https://www.peterdag.com/
I struggled to find 5 top picks for 2020, I was only able to come up with 2:
For a speculative pick, I still like ROKU, as it is not tied to single streaming supplier – it supports Disney+, Hulu, Netflix, just about every streamer out there. And they have their own ad-supported Roku Channel. As I said on traditional value metrics I would not pick them but I bought a small amount of shares back in 2018 at about $47, and the stock is now about $148! I still think that this stock has room to grow.
(in his own words…)
CELG – Jan 2, 2019 – 63.19, bought by BMY on Nov 25, 2019 at 108.24, 71% gain
LRCX – Jan 2, 2019 – 133.46, current price is 295.69, 121% gain
FB – Jan 2, 2019 – 128.99, current price is 206.30, 60% gain, close to my year end target of 219

https://onthemarkinvesting.com/wp-OTMcontent/uploads/2018/03/Capture.png
In any event, note the technical trend for Largecap, Midcap, Smallcap, Microcap, Longbond, Gold, and Real Estate in the box below. They are all BUY in all periods. That is (historically) unusual, and counter to long term correlation — as you can see by the Correl (correlation) column, these asset groups are not highly correlated yet they are all BUY in the model and generally have all been trending upwards due to the worldwide search for yield.
All of this to the point that it is about time to begin to fly the plane using Instrument Flight Rules instead of Visual Flight Rules, as it is going to start getting stormy. Data typically reverts to its mean, and in this case, at some point, these relationships are going to begin to diverge back to historic patterns.
I have been preparing for such a thing in the model and will be issuing updates appropriately. If you have a particular security that you’d like a snapshot on let me know.
Mark
