Psychology of a Market Cycle
Where do you think this market is right now? The pessimist in me tells me that absent the government flooding the market with more money that we are in the Euphoria stage.

Courtesy of wallstcheatsheet.com
Conservative. Smart. Investing.
Where do you think this market is right now? The pessimist in me tells me that absent the government flooding the market with more money that we are in the Euphoria stage.
Courtesy of wallstcheatsheet.com
I have added a check on Breadth to the base algorithm. This is looking at the number of stocks reaching new highs versus new lows, the number of stocks advancing versus declining, and the number of stocks above or below their 21dma. It looks at this data across the S&P100 (very large caps), S&P500, S&P400 (midcaps), and S&P600 (small caps). Version 54 performs with a higher RAR and higher Win Percentage than V53.
As you know the Retirement ETF algorithm is rather simple, looking for a monthly cross of the 200dMA. The picture below is an XY plot of the ETFs that are in the Retirement portfolio.
On the X Axis is the Percent Variance of the Price to the 50dMA.
In the attached picture you can see the status of Industry Sectors using a short term (price versus 50dma) and long term (price versus 200dma) as of yesterday’s close.
We will begin watching how sectors soften and harden as a leading indicator of economic and market change.
One of the most eye-opening aspects of investing is the impact of market declines on your total return. If you make 15% in year 1, another 15% in year 2, another 15% in year 3, and then you lose 15% in year 4, you earn….6% annual return. That one year of 15% loss cuts your four year annualized return to just 6%.
The linking of economic cycles with the technical investing algorithms is an important part of our ETF algorithm. The model has been updated to Version 53 to include refined economic criteria.
In Version 53 the trade entry logic was further refined using an analysis that was conducted by Fidelity Investments and summarized in the table below. As a result of this refinement the backtesting results (1/1/2003 – current period for our target ETF securities) for the algorithm have improved slightly:
In a post in SeekingAlpha on January 27th of this year (https://seekingalpha.com/article/4401277-market-and-earning-cycles-point-to-pause-in-2022 George Dagino wrote:
“The last bottom of the business cycle took place in March 2020. Growth should therefore show a peak in 2022, assuming the upward leg of the cycle is two years. This should be also the time growth in earnings will begin to slow down.
The following is guidance from the American Association of Individual Investors about how buy and sell orders should be placed:
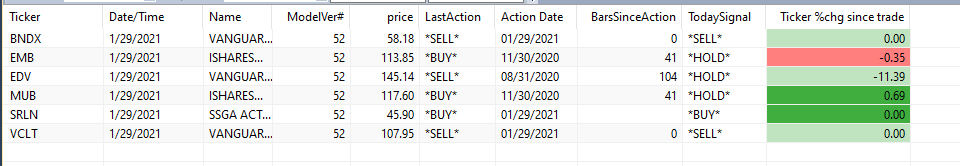
Note that the model suggests holding EMB – MUB – SRLN at this point.
VCLT is a SELL as of yesterday.
SRLN is a BUY as of yesterday.
BNDX is a SELL as of yesterday.