There hasn’t been much to discuss for the longer term investor since my last (September 9) note. While the overall market has risen, it is a weak market rise. You can see it in the technical data below.
The first thing to notice is that small caps and micro caps are not participating. I included the Russell 2000 small cap chart to illustrate that the model technically calls it SELL in all periods. Same with the micro caps. As I’ve noted before, these smaller stocks are bellweather — they rise first and they fall first. They are not participating with the “greener” mid and large cap securities. This is a warning sign.
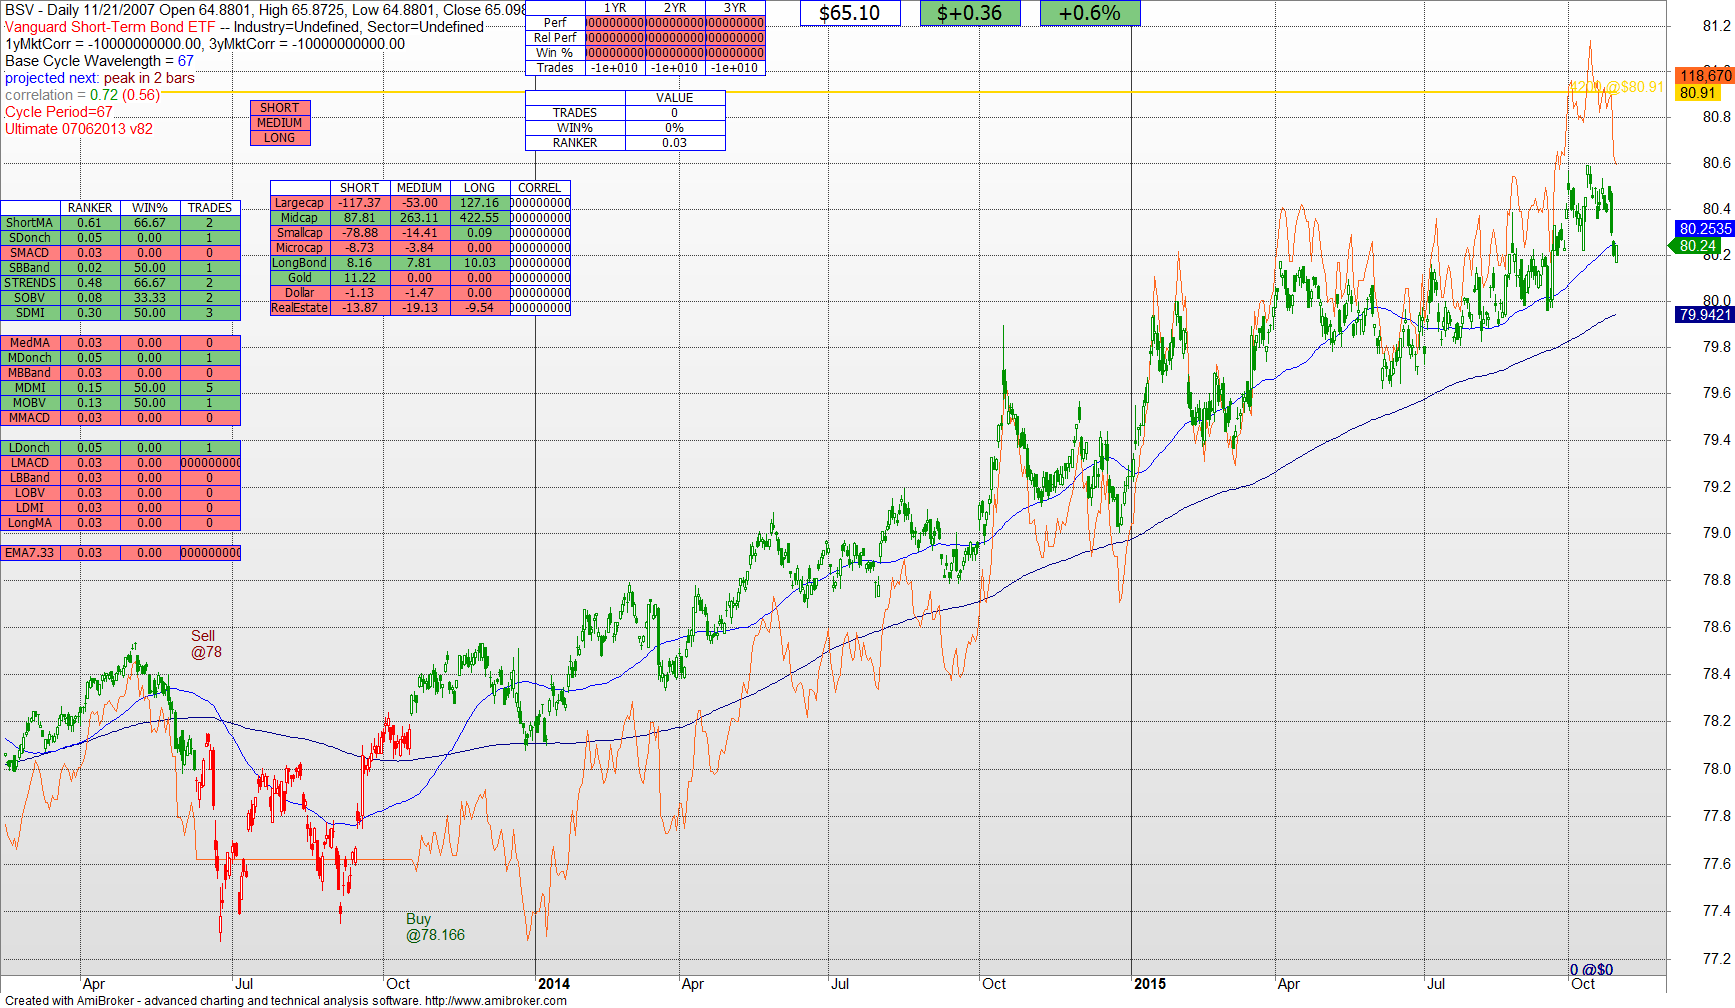
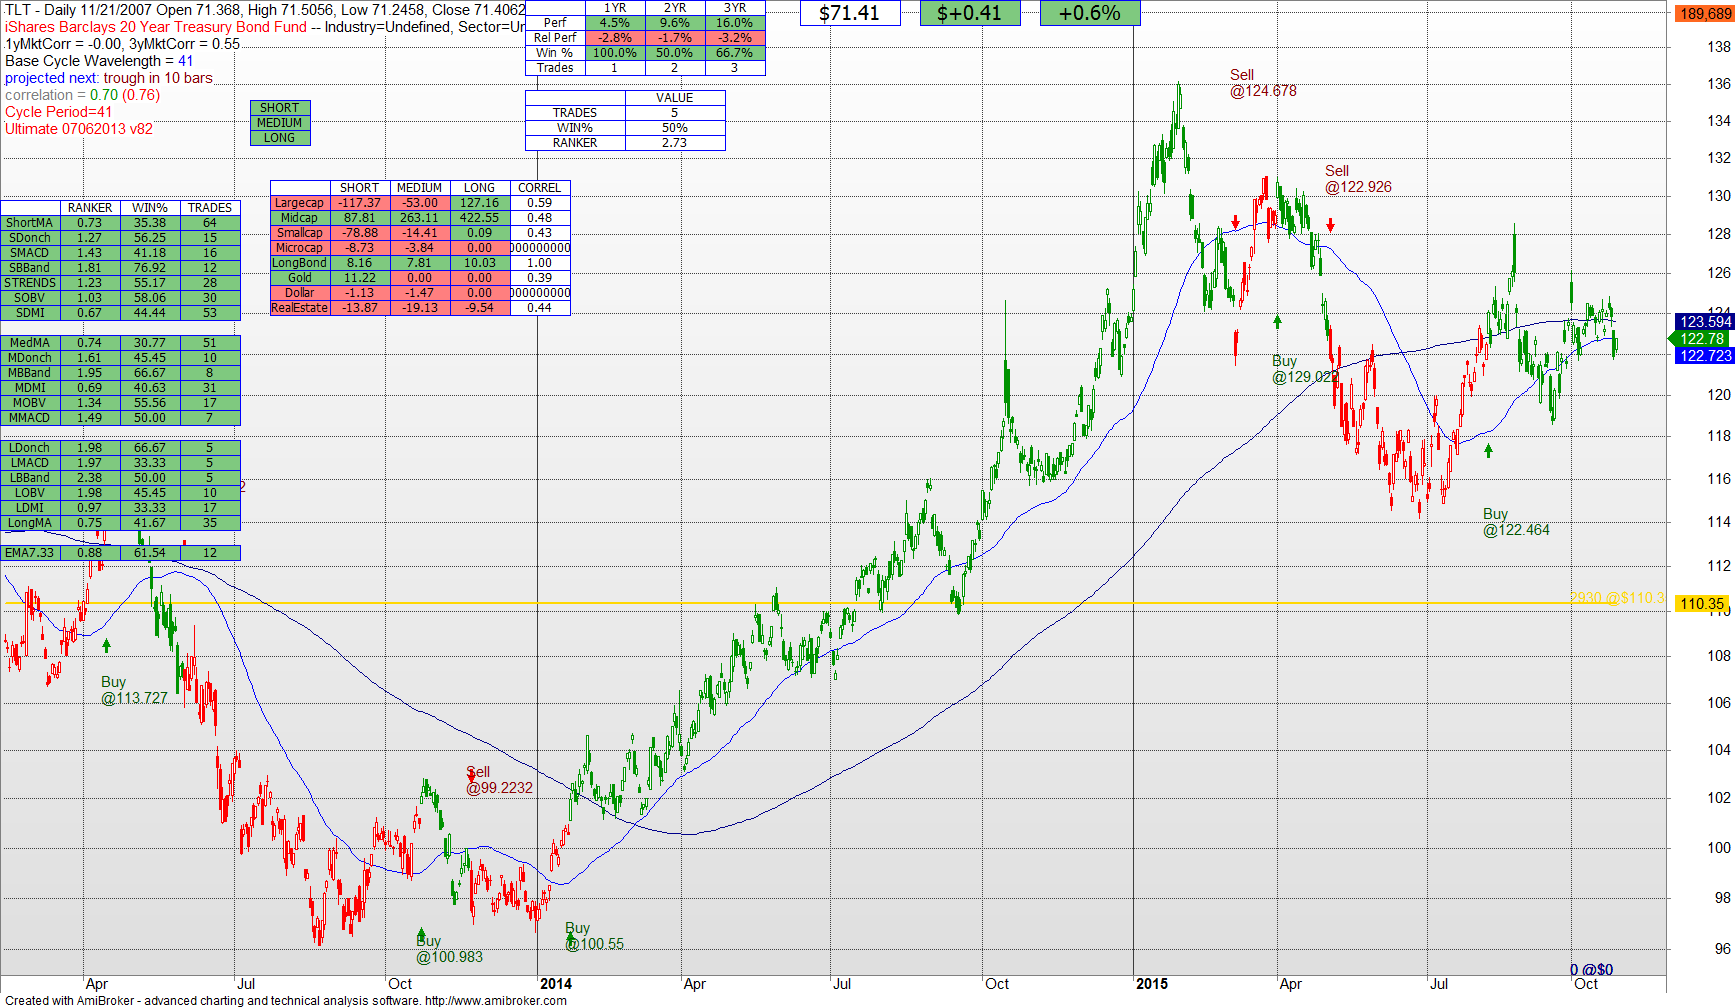
Long bonds are still good technically. The short bonds as well. I continue to be comfortable with the 75% plus bond/cash allocation that I called for back on August 24. Sure the S&P is up since then, but I continue to see this underlying weakness, and I see the technical chart for the S&P not showing me that money is just there ready to be picked up. So I stay conservative, diversified across different bond groups (TLT long bonds, BSV short bonds, BIL cash equivalent, CSJ commercial bond, MUB municipal tax free).
Oftentimes the holiday period is good for investors. If the models change their tune I’ll change mine. And sing my holiday songs all the way to the bank.
You will note some improvements to the technical model. The biggest of which is that the short, medium and long periods are being determined based upon the best-fit natural cycle of each security. And in the case of the broad market (^GSPC) the model is saying that the S&P has a natural 57 day trading cycle and that it is about to head into a downward period hitting the trough in 20 trading days. That may not be perfect, but it is another data point.
I will be posting as conditions warrant. But for right now I am primarily on the sidelines and this market is weaker than it looks.
Mark