Attached is the most recent backtest report for the technical model as run against a universe of 640 high volume ETFs. The first trades start in 1997.

Portfolio equity increases at a pace much slower than the NASDAQ composite. Many of these ETFs are bond funds, and the model is indifferent to asset allocation. There are losses in 6 years of the 22 year period (2000,2001,2002,2008,2011,2015), although none top 8.8%. What you can see is that again the model is designed to protect against severe downtrends. So far in 2015 the model is down 0.6% through yesterday.
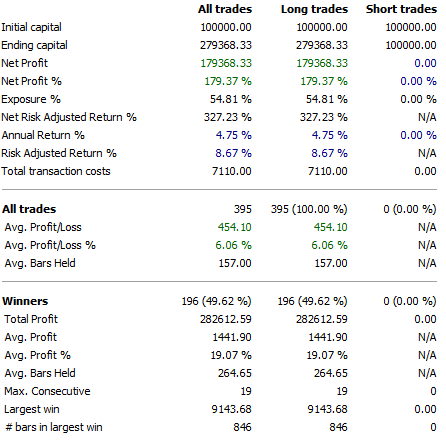
Risk adjusted return — that is, the return of monies actually invested — is 8.67%. The average length of time of a trade is 157 trading days, or a little over 7 months.
Winners are held about 210 days longer than losers, and the win percent is almost 50%.
The attached backtest listing is a summary of the trades, including those that are still “open”.
07062013 final v76 backtest ETF