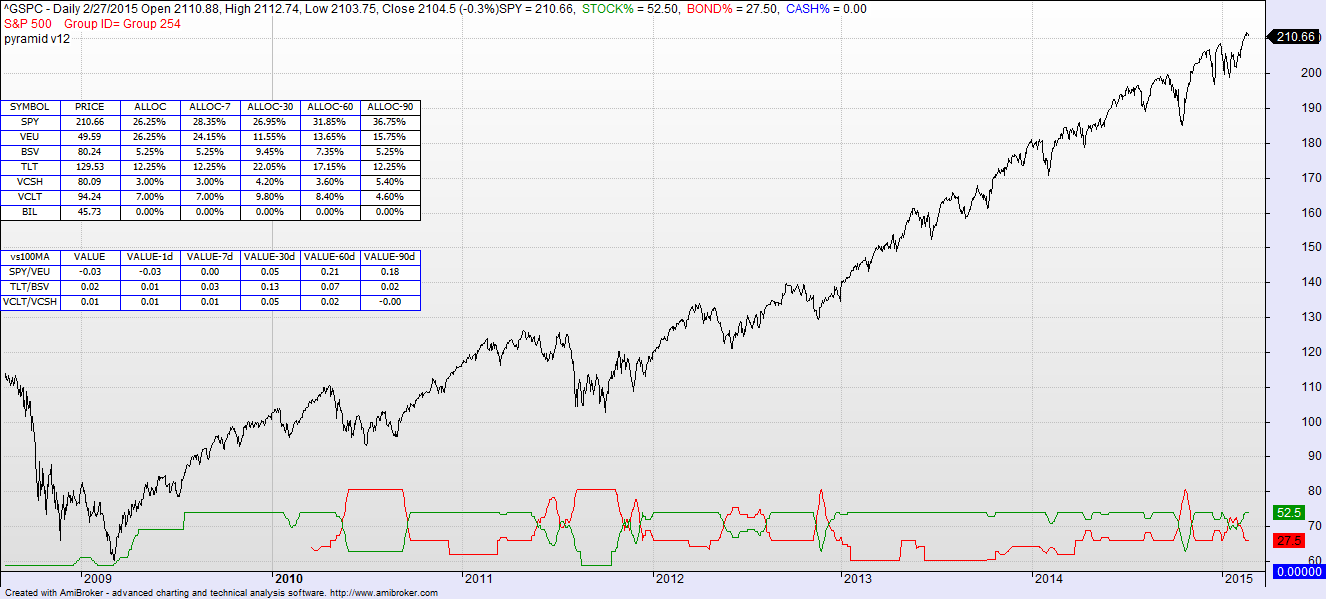
Prior Week Market Performance:
- The S&P large caps lost 0.3% last week to 2104.50.
- The Russell 2000 small caps gained 0.3% last week to 1233.37.
- Long Bonds (TLT) gained 2.4% last week to 129.53.
- Asset Allocation Model: unchanged. Stocks (52.5%); Bonds (27.5%); Discretionary (20%)
Last Week’s Commentary: The overall market is as expected. Stocks continue to creep up and are in the middle of a broadening pattern with good technicals. Long bonds are in a short term correction. Note that they are correcting at about 2x the rate of the large cap market increase, so if you are properly diversified long term at 2x stocks to bonds you are unchanged on balance. Changes are equal that the broad market will go up or go down this week. It is in the middle of a channel. But any change should be relatively mild, and the longer term signs are all positive.
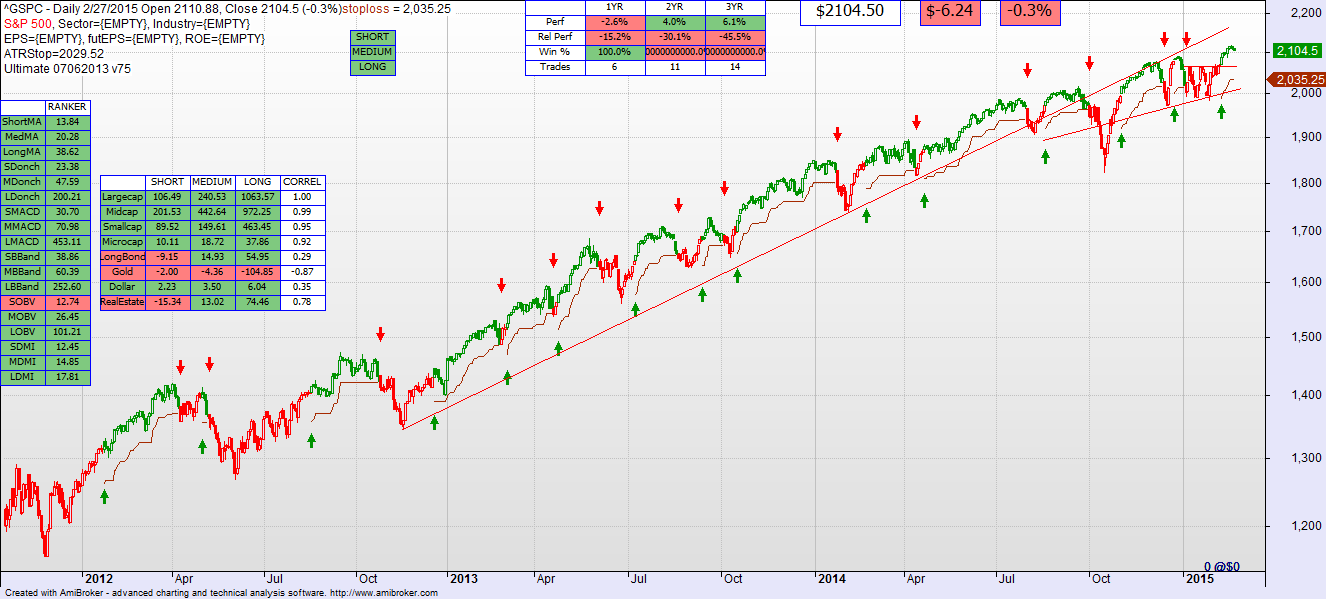
Current Technical Model Indicators (Short, Med, Long periods):
- Large Cap S&P 500 – BUY, BUY, BUY
- Mid Caps – BUY, BUY, BUY
- Small Caps – BUY, BUY, BUY
- Micro Caps – BUY, BUY, BUY
- Long Bonds – SELL, BUY, BUY
This Week’s Commentary: Same as last week. The correlation between SPY and TLT (S&P to Long Bonds) is 0.28, implying little correlation at all. As long as Yellen and the Fed are going to be cautious about raising rates, TLT and its 2.4% dividend yield is not a bad bet to offset the riskiness of the equity portfolio. That being said, we are nearing the point where we’ll start to shift the bond position from long to short. That point is coming.