Prior Week Market Performance
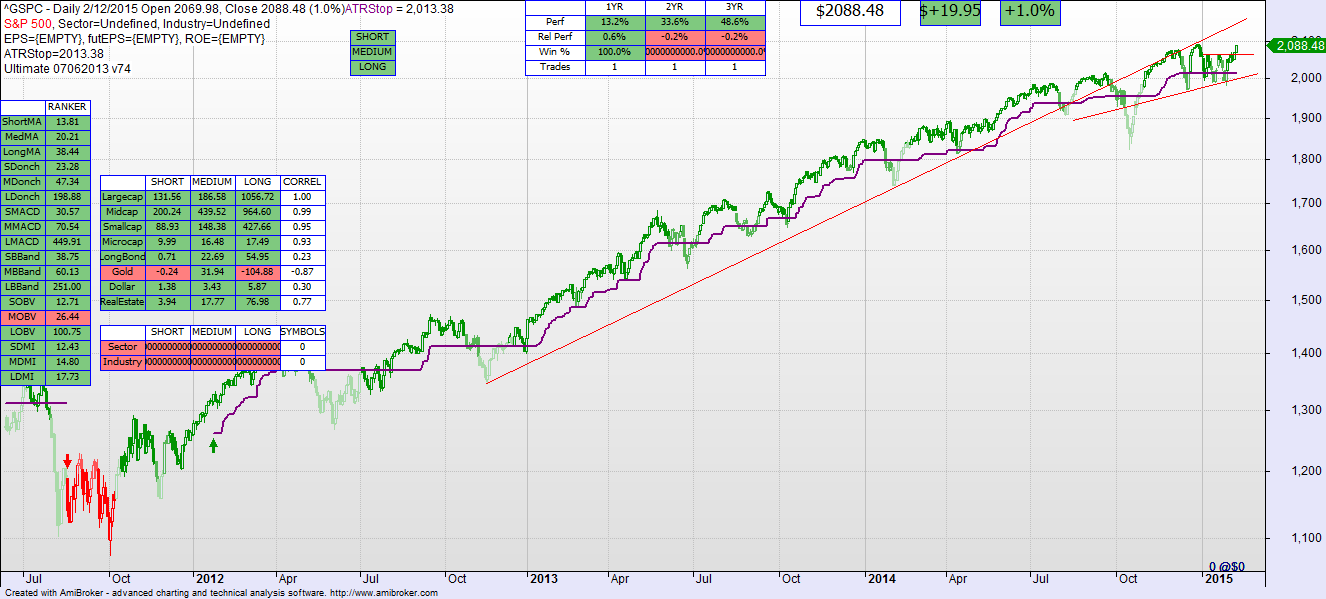
- The S&P large caps gained 1.6% last week to 2088.48.
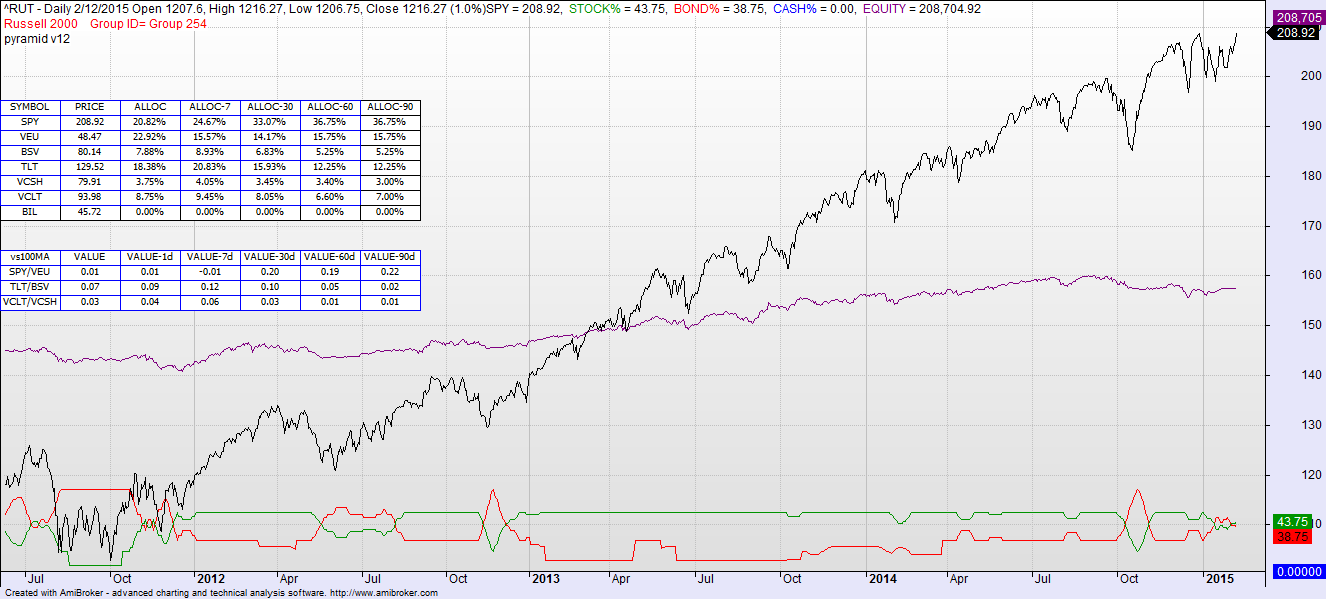
- The Russell 2000 small caps gained 0.9% last week to 1216.27.
- Long Bonds (TLT) lost 1.1% last week to 129.52.
- Old Asset Allocation Model: 45.5% Stocks (up from 42%), 36.5% Bonds (down from 41%), 0% Cash, 18% Discretionary.
Last Week’s Commentary: There is still a black swan lurking in the water. The difference between the S&P500 and the broad market in general remains. There continues to be more decliners than advancers in the NASDAQ composite on a day in day out basis as the chart below shows. We are keeping another week’s lookout on the S&P. It needs to clear that 2063 resistance point and stay above it the balance of the week. If it does, the market will run a bit. If it does not, look for a down week for stocks, an up week for bonds, and more of the same until the swan appears.
Current Technical Model Indicators (Short, Med, Long periods)
- Large Cap S&P 500 – BUY, BUY, BUY
- Mid Caps – BUY, BUY, BUY
- Small Caps – BUY, BUY, BUY
- Micro Caps – BUY, BUY, BUY
- Long Bonds – BUY, BUY, BUY
This Week’s Commentary: Sometimes one can get too fancy. Can get “too clever by half”. Can miss the forest because they are busy cutting down a tree.
The technical models have clearly been saying that the market is fine. I have been paying attention to the classic patterns such as triangles and wedges, but should have been paying more attention to the models that I’ve spent so much time building. In looking for an edge, I end up cutting myself with that knife.
An example of this is the revised Asset Allocation model. Although it performed better in the backtesting, the exclusion of a security because it was not a BUY causes quite a bit more volatility than I want. And it is just not the right approach for a long term investor that wants some consistent, week to week holdings with little changes. I changed it because of a concern that it would not be responsive enough during an upcoming downward trend. I overreacted. So I am going back to the old Asset Allocation model that worked so well in the past. And shut up about it.
At this point a market analysis is simple: the market looks healthy. Leading indicators are still looking good. Asset allocation is 45/36 stocks to bonds and the remaining 18% is your call.
Just keep it simple or you’ll look stupid. As I said to myself….


