Prior Week Market Performance
- The S&P large cap index gained 3.0% last week to 2055.
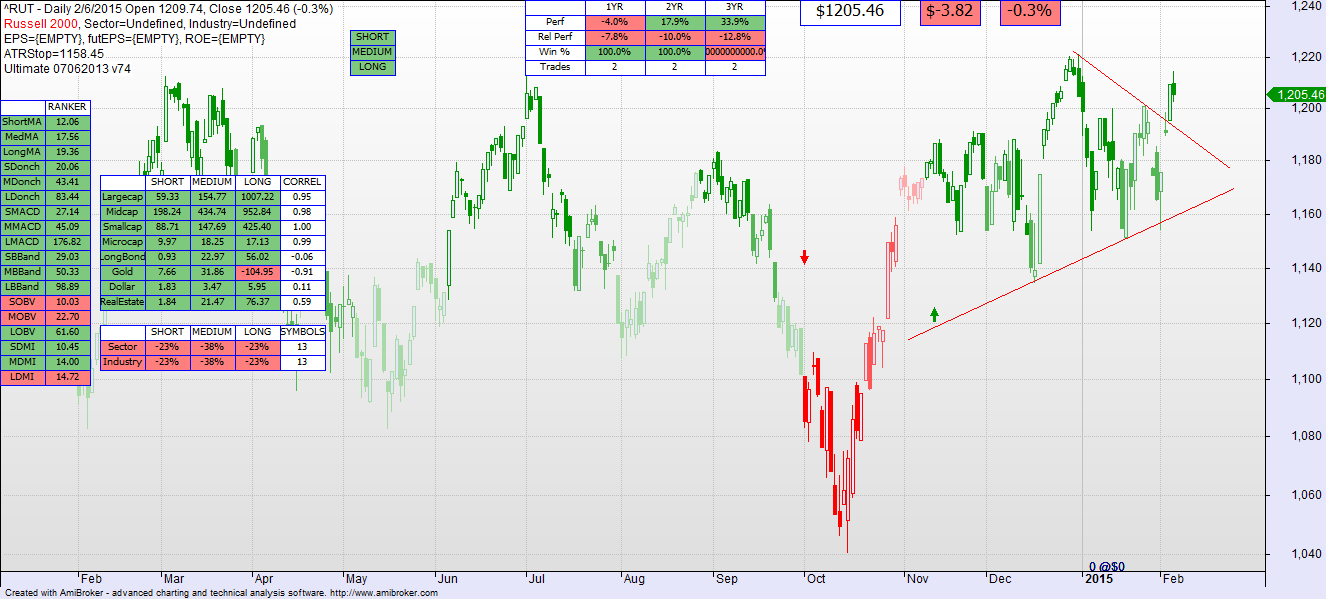
- The Russell 2000 small cap index gained 3.4% last week to 1205.
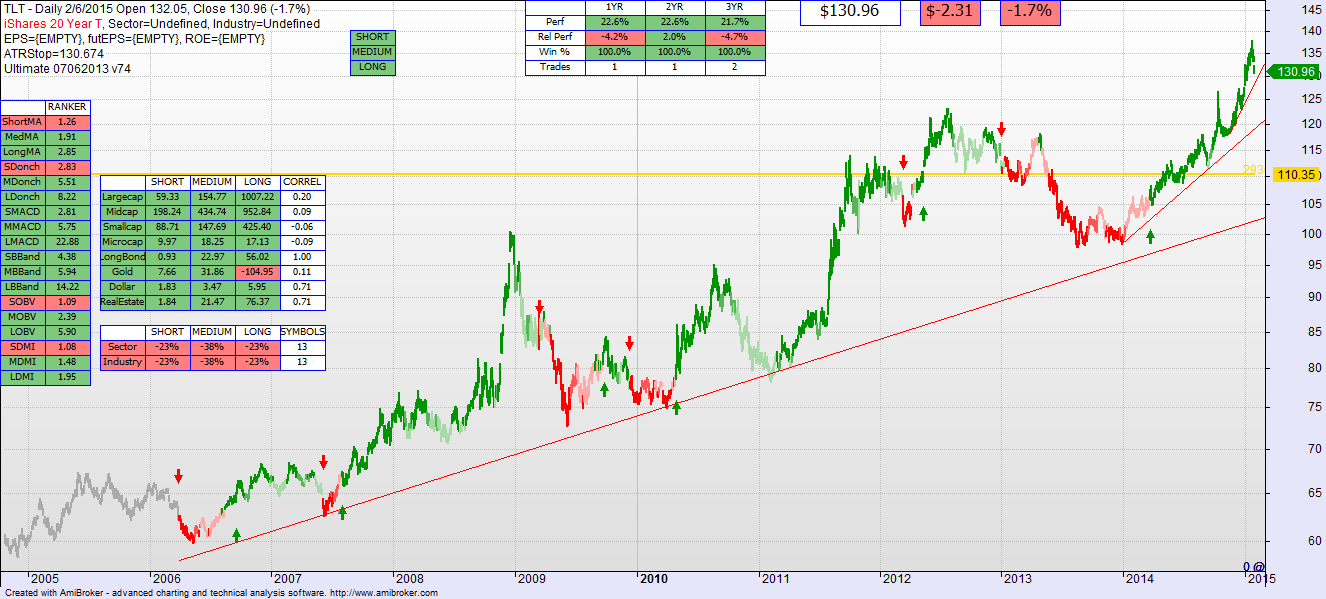
- Long Bonds (TLT) lost 3.6% last week to 130.
- Asset Allocation Model: slightly changed at 25% (down from 26%) Stocks, 38% (down from 45%) Bonds, 26% Cash, 10% (unchanged) Real Estate.
Last Week’s Commentary: I think the Asset Allocation model is right. I think that it is time to shift some of your wealth toward bonds, and cash. I think that we are in a risky period here. The market has not moved substantially yet, and the technical models are still optimistic in the medium and long term periods. But I keep waiting for that divergence in the AD Line to hit, and the forming Triangle (some would call it a descending wedge, which is a negative sign) is not a good omen on the horizon.
This Week’s Commentary: As you can see below, the S&P 500 moved upward, out of that two-month triangle formation that I referred to last week. It has hit some resistance as you can also see at 2063. If this market closes above 2063 for three days or so, it will likely rise well above it, up to 2120 or so given standard technical charting logic.
I have always said to you that the small caps lead the large caps. The Russell 2000 chart below shows a definite break out of the triangle. Not yet high enough to declare victory but a good sign nonetheless for the overall market.
But why is it then that the Asset Allocation model is heavily weighted toward bonds? Because the current trend is with Bonds. While stocks have been in a sideways pattern (triangle), Bonds have been knocking the lights out as you can see below. Long bonds are up 9% this year alone. 31% in the trailing 12 months. We have ridden that horse in part the whole time. Unless this is the very moment that all of that changes, as an intermediate term investor it makes sense to wait until we see a clear change in upward course before shifting our assets.
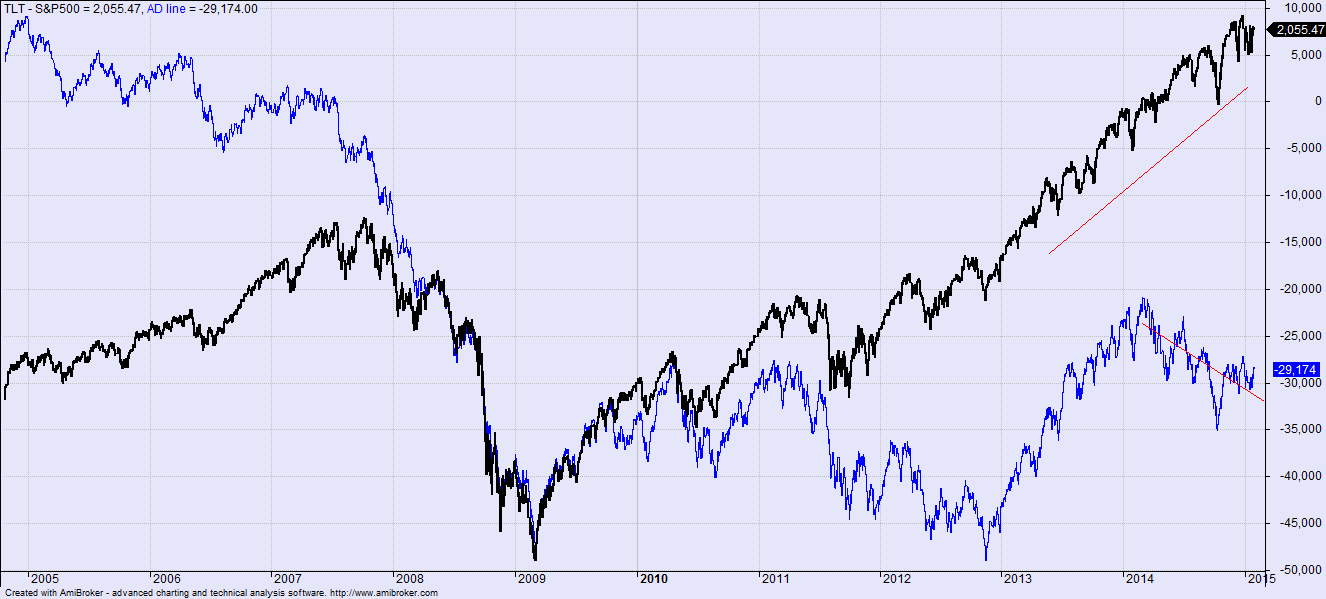
There is still a black swan lurking in the water. The difference between the S&P500 and the broad market in general remains. There continues to be more decliners than advancers in the NASDAQ composite on a day in day out basis as the chart below shows.
We are keeping another week’s lookout on the S&P. It needs to clear that 2063 resistance point and stay above it the balance of the week. If it does, the market will run a bit. If it does not, look for a down week for stocks, an up week for bonds, and more of the same until the swan appears.


