Prior Week Market Performance
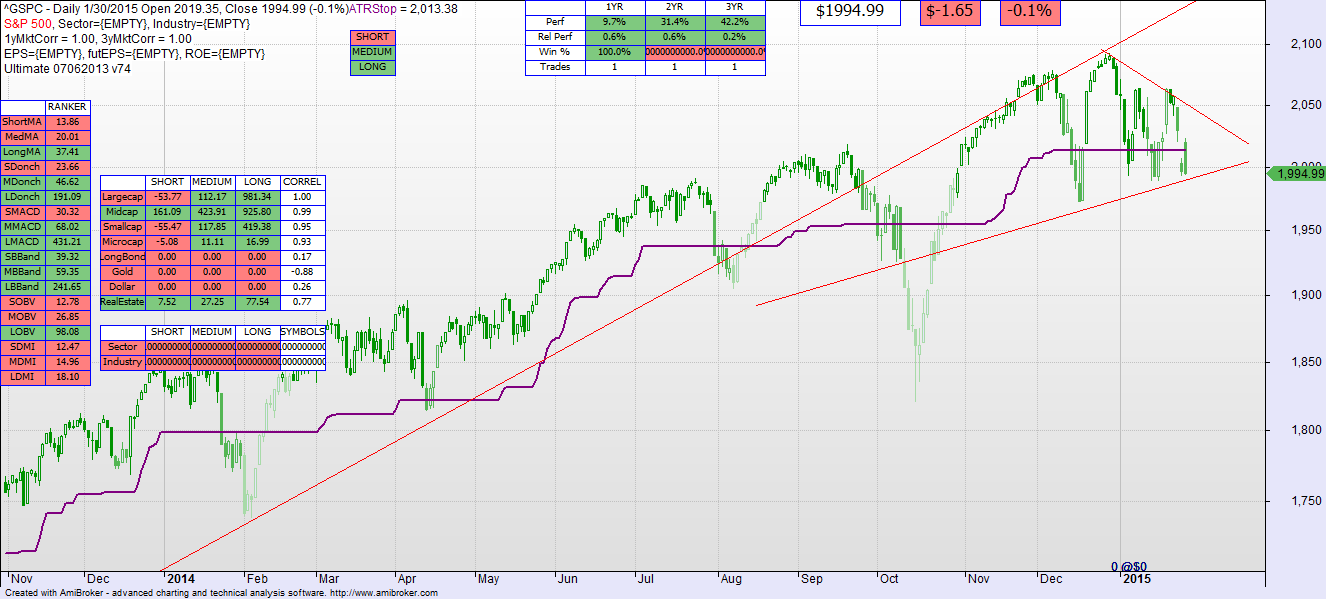
- The S&P large cap index lost 2.8% last week to 1994.
- The Russell 2000 small cap index lost 2.0% last week to 1165.
- Long Bonds (TLT) gained 0.8% last week to 135.
- Asset Allocation Model: materially changed at 26% (down from 44%) Stocks, 45% (up from 39%) Bonds, 17% Cash, 10% Real Estate.
Last Week’s Commentary: The asset allocation model has predictably moved to bonds in light of the short term weakness in the large cap market. But personally I’d give this a week to see a confirming signal in the small and medium caps. Stay put until there is a bit more clarification in direction.
This Week’s Commentary: As you can see in the picture of the S&P 500 below, this market has been oscillating, on a more and more frequent basis, with lower highs and higher lows. It has formed a triangle, and that formation usually results in a significant move either upward or downward. Further we are 2/3 into the triangle, which is also the right point for the move.
To figure out where the move is likely to go, lets look at the Russell 2000. It often leads the overall market. If you look at the RUT chart below, you also see a pronounced triangle that has formed. Again it is ticking toward a move….so lets continue to look for guidance.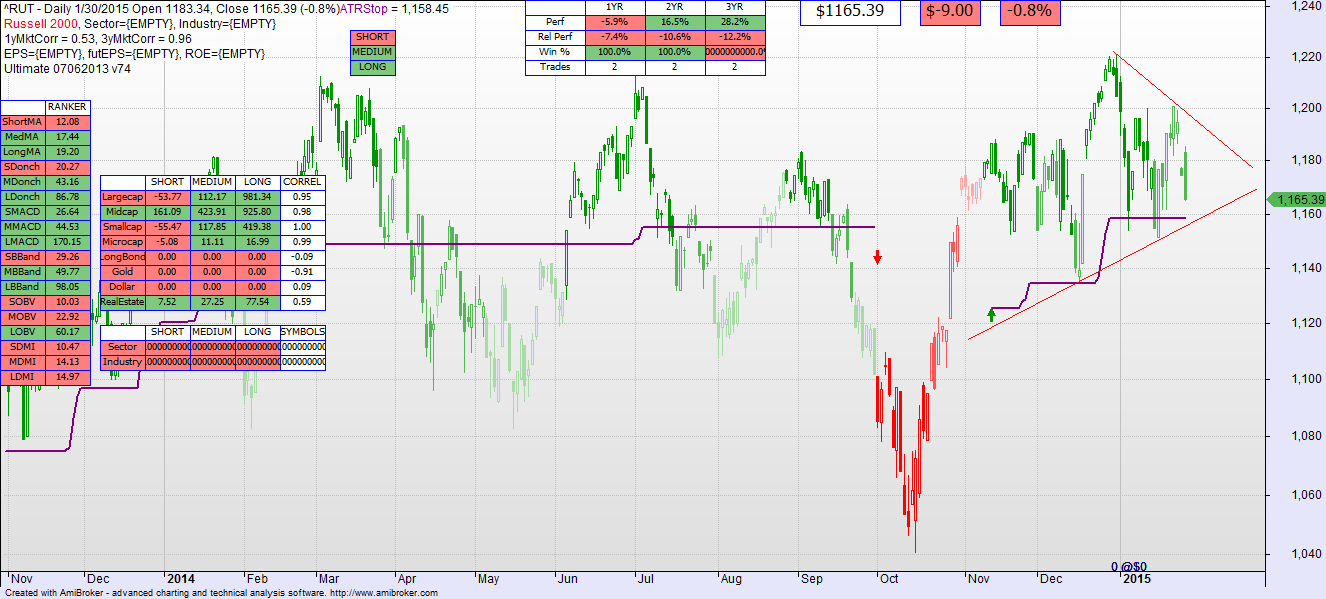
If you look at the technical model associated with each of the above charts, the short term period is not a BUY. But the medium and long term periods continue to be BUY, albeit weakening. This is consistent with the Triangle, where there is a sideways oscillation in the near term period but no material movement (yet) in the longer terms.
The key may be in the AD line below. This chart compares the S&P500 (in black) to a running count of advancers minus decliners in the Nasdaq composite. Note that during the whole course of 2014 there has been a falling number of advancing stocks versus declining. Yet the S&P 500 continued to go up. I have commented on this in the past.
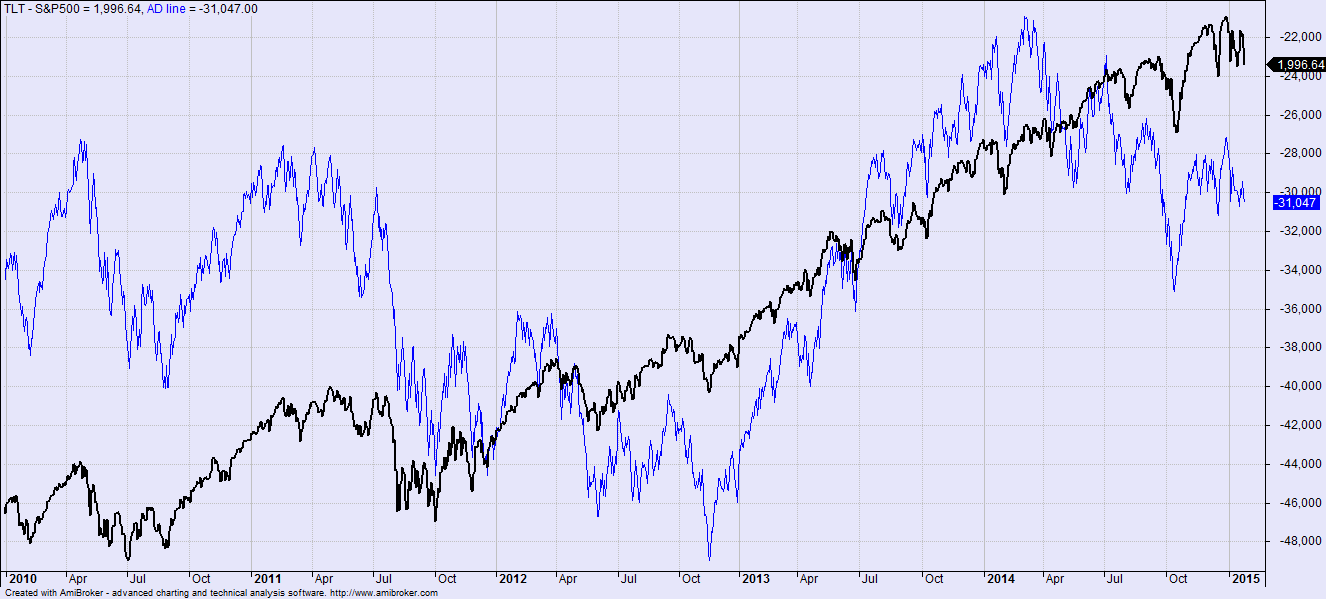
Look at this same chart below, going back a few more years. See that before the drop in 2008 there was underlying weakness in the AD line. The big name companies did well, but in the broad there was weakness. As you can see that same kind of weakness is there today.

I think the Asset Allocation model is right. I think that it is time to shift some of your wealth toward bonds, and cash. I think that we are in a risky period here. The market has not moved substantially yet, and the technical models are still optimistic in the medium and long term periods. But I keep waiting for that divergence in the AD Line to hit, and the forming Triangle (some would call it a descending wedge, which is a negative sign) is not a good omen on the horizon.
Stay diversified, and don’t enter the market at this time.