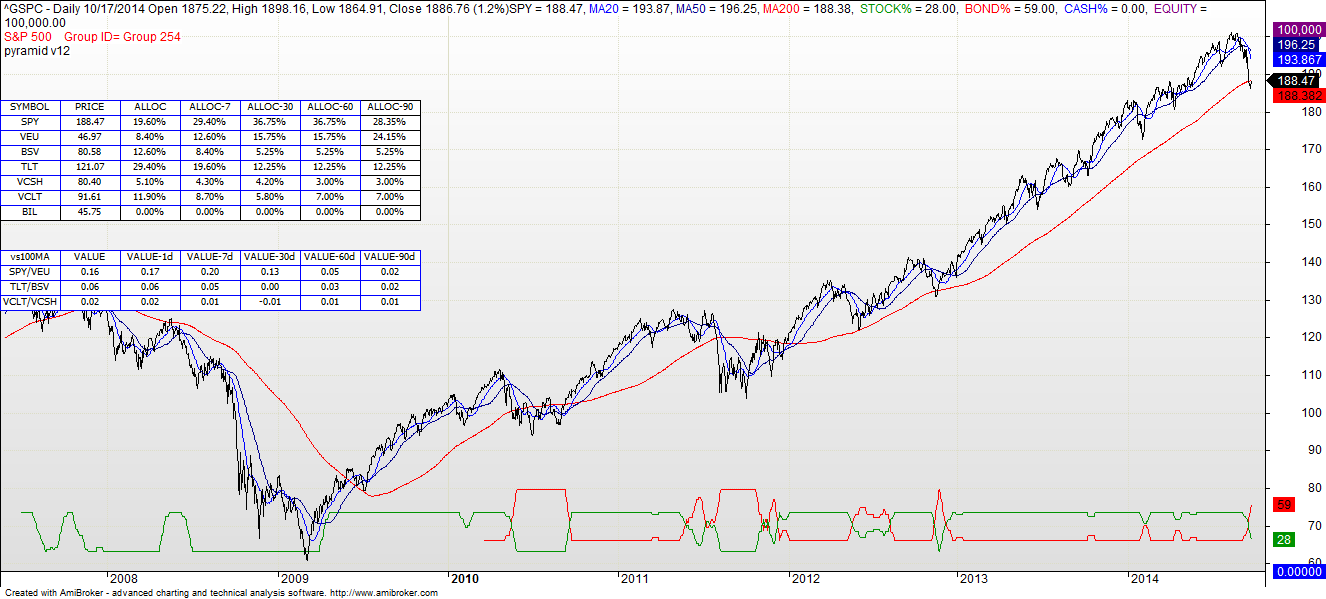
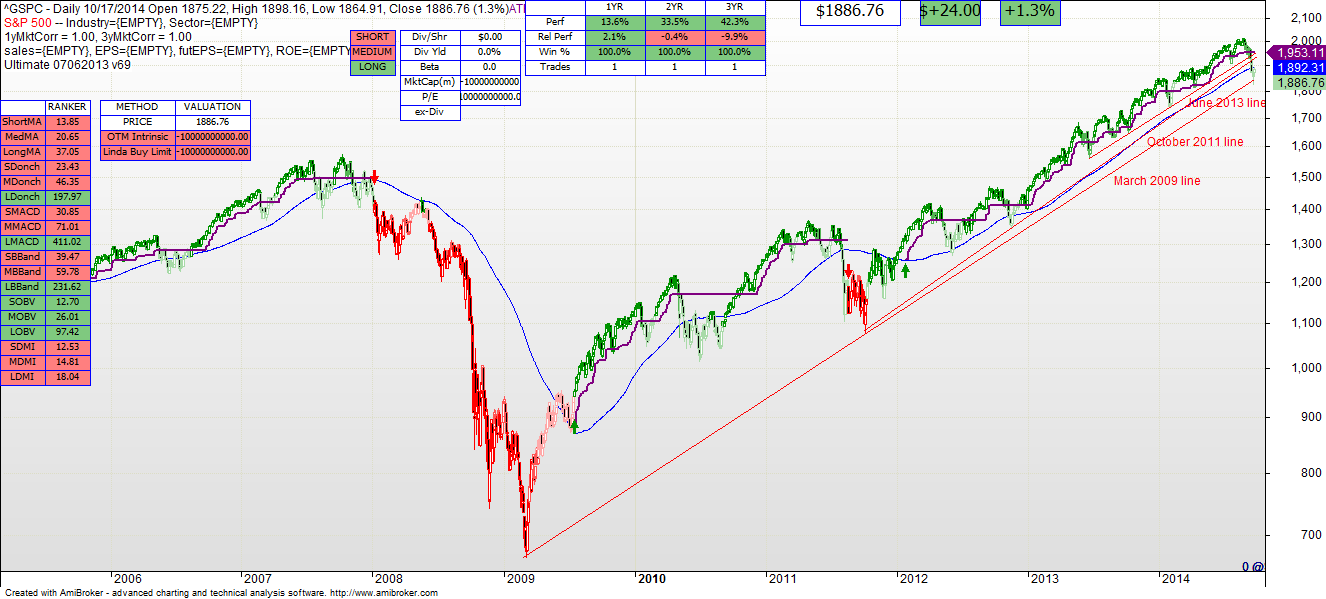
The S&P 500 has “corrected” 6.6% since its high on September 19. So what is next, and what to do about it? Here is a suggested order of analysis: 1) First, asset allocation. The asset allocation model presently recommends a split of 59% Bonds / 28% Stocks / 13% Optional. Traditionally these splits don’t move too much week to week. In fact I would check them a) weekly only, and b) just move monies to stay in sync if I was out of whack more than 5% (500 basis points). You can see from the chart below that this “inversion” of the stock/bond percent spread has happened several times in the past few years. 2) Secondly, note that the S&P is still a long term BUY in the technical model. It is however not a BUY in the intermediate or short term ranges. The 4Q of the year is traditionally a good time for the market, and I would not be surprised to see another upward move. But…..on technical grounds (and you can see this in the charts below as well), two very long and important support trend lines have been violated. There is speculation that this violation is part of the reason for the drop and the volatility. Trend lines tend to become resistance when they are violated, so….my working hypothesis is that we are not going to see a big uptick in the market in the near term. In fact we may not be done in the current correction cycle. 3) On October 5 I mentioned that small-cap stocks often “lead the charge”. The Russell 2000 has not begun to recover. In fact it went down again on Friday. So…I would advise to get your target asset allocation where you want it — always. But as the numbers above indicate, you may want to hedge this market a bit. If the S&P reverses course and rises again, you can join the fun later. But it is as likely that we are not done yet on the downside.


