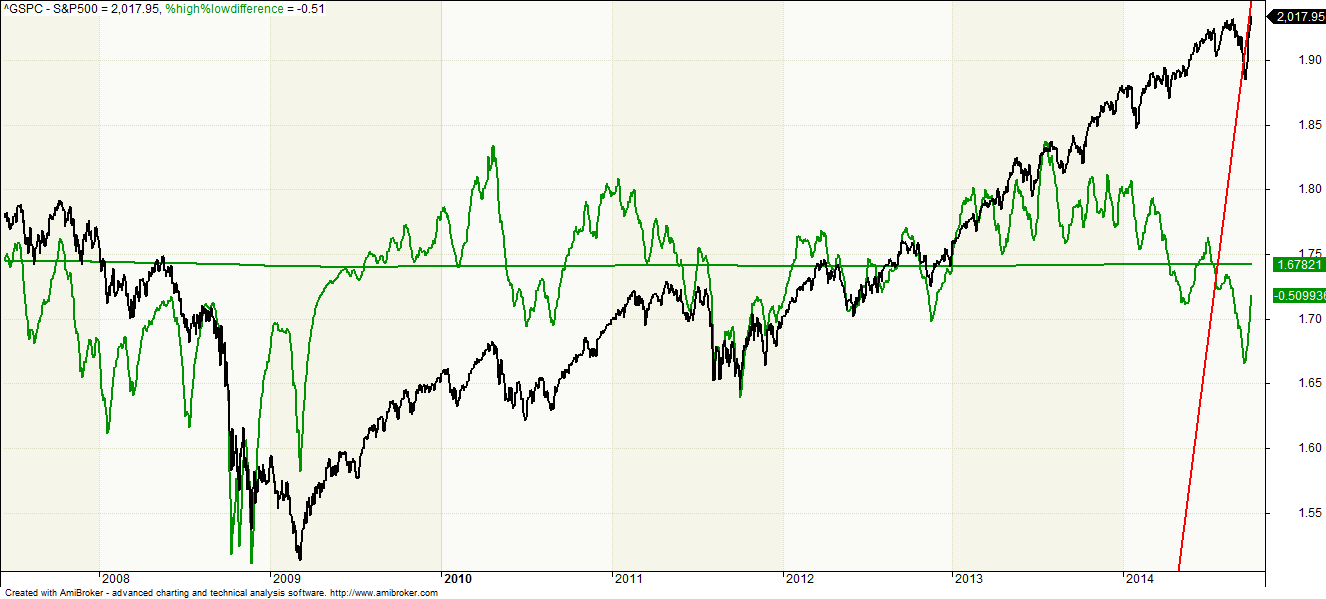
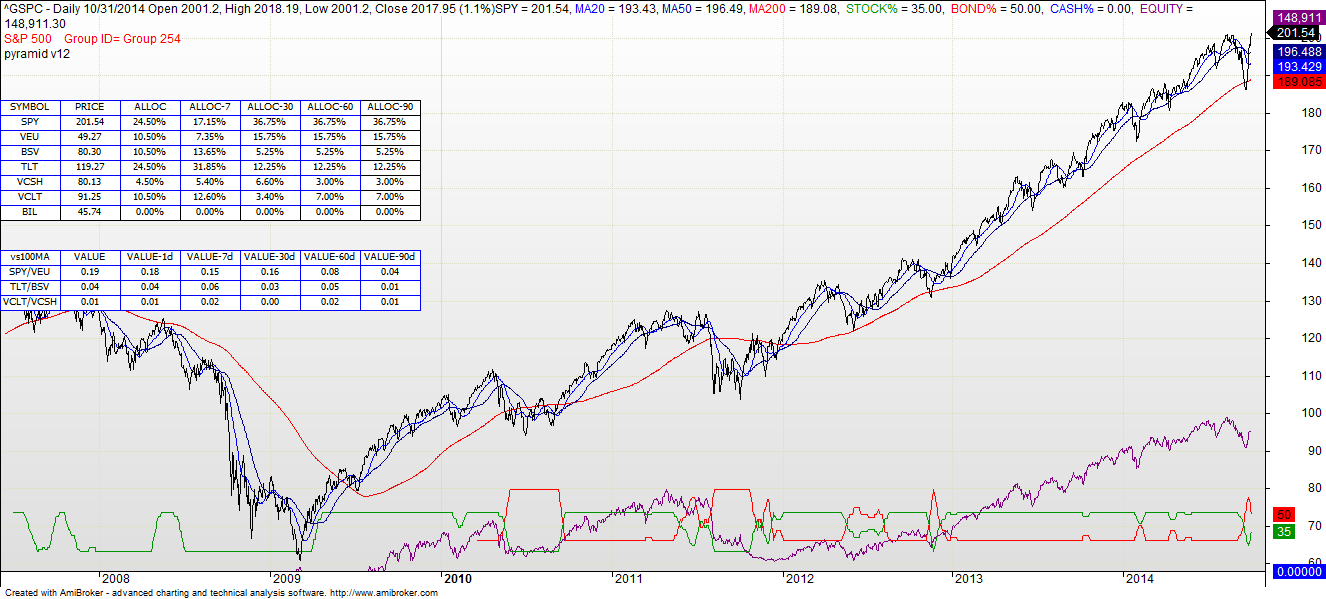
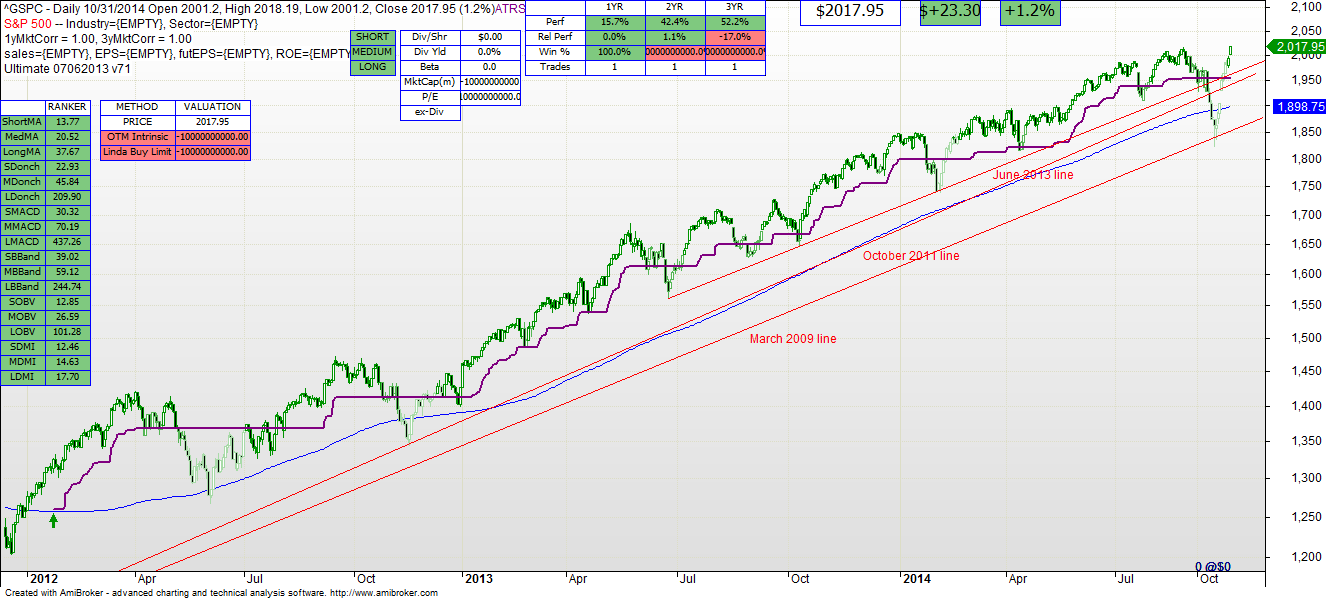
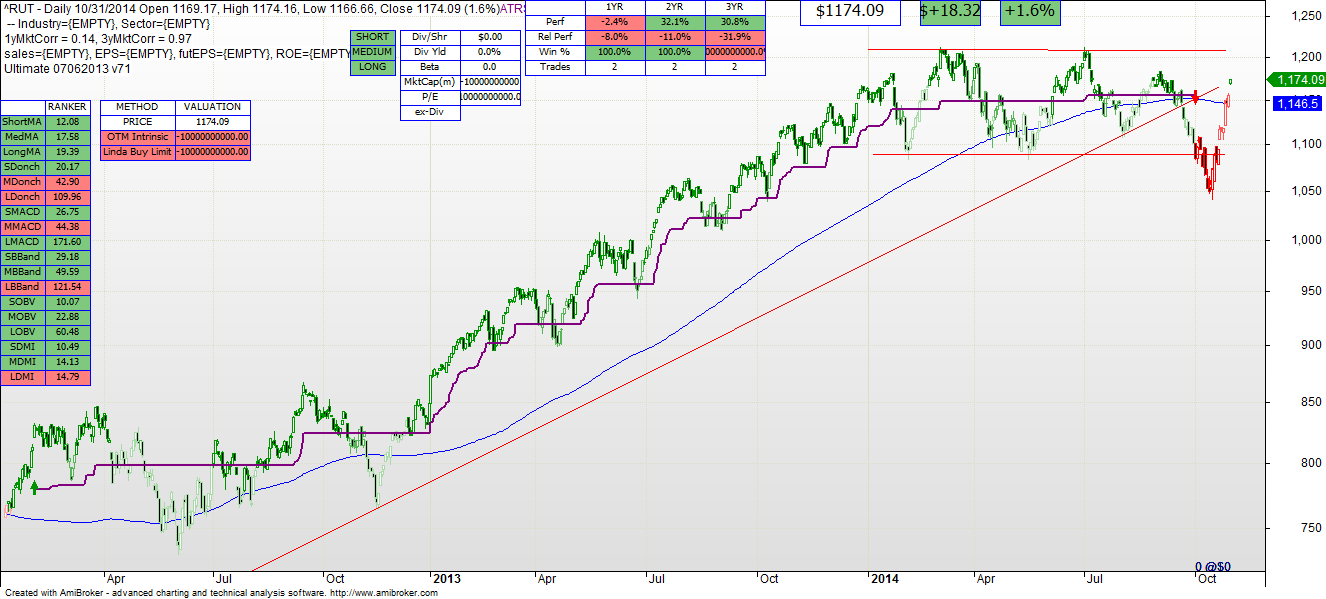
The S&P went up 2.7% last week, including a 1.2% jump on Friday. It has reclaimed all that it lost in recent weeks, and is now at an all time high. Yet, despite the talk of analysts and others, I am not convinced that this trend will continue. Let me lay out a few facts that have nothing to do with Bank of Japan actions or Fed actions, but do have everything to do with a lot of other people’s actions. Fact 1: The cumulative number of Advancing versus Declining NASDAQ stocks is negatively diverging versus the S&P. The chart below subtracts the number of stocks going down in a day from those going up in a day. If the trend is down in the BLUE line below, more stocks are dropping than going up. Over the past few months, even though the S&P has generally been rising, more individual NASDAQ (smaller) stocks are falling than going up. Signs that smaller stocks are having trouble. Fact 2: If you subtract stocks hitting a new 52 week low, from stocks hitting a new 52 week high, you get the GREEN line below. Again you can see that more NASDAQ stocks are hitting new lows than hitting new highs. Yet the S&P continues to trend up. This again is a sign of broad weakness in smaller stocks Over the course of the past several weeks I have mentioned that small stocks lead large stocks. So again we look at the Russell 2000 for guidance. It is conflicting guidance. Yes the technical model for the Russell 2000 is all BUY, but until it clears that upper RED resistance line I will not be convinced. The S&P 500 technical graph below is BUY for all timeframes. As with the Russell 2000 technical model, all seems “GO”. Summary It appears to me that headline-producing actions by various governments have driven investment in large, prominent stocks such as those in the S&P 500. But there is definite weakness in the rest of the market. The mechanical models say “BUY” but like the market in general they are being materially influenced by governmental activities. Be careful in your asset allocation and do not assume that it is time to be aggressive with stocks. The asset allocation model (https://onthemarkinvesting.com/otm-asset-allocation/) only assumes 35% stock allocation at this time, versus 50% bonds. Given the risk in the market as a whole, that seems appropriate to this observer.
Conservative. Smart. Investing.


