The best way to understand the market is to look at it in various timeframes.
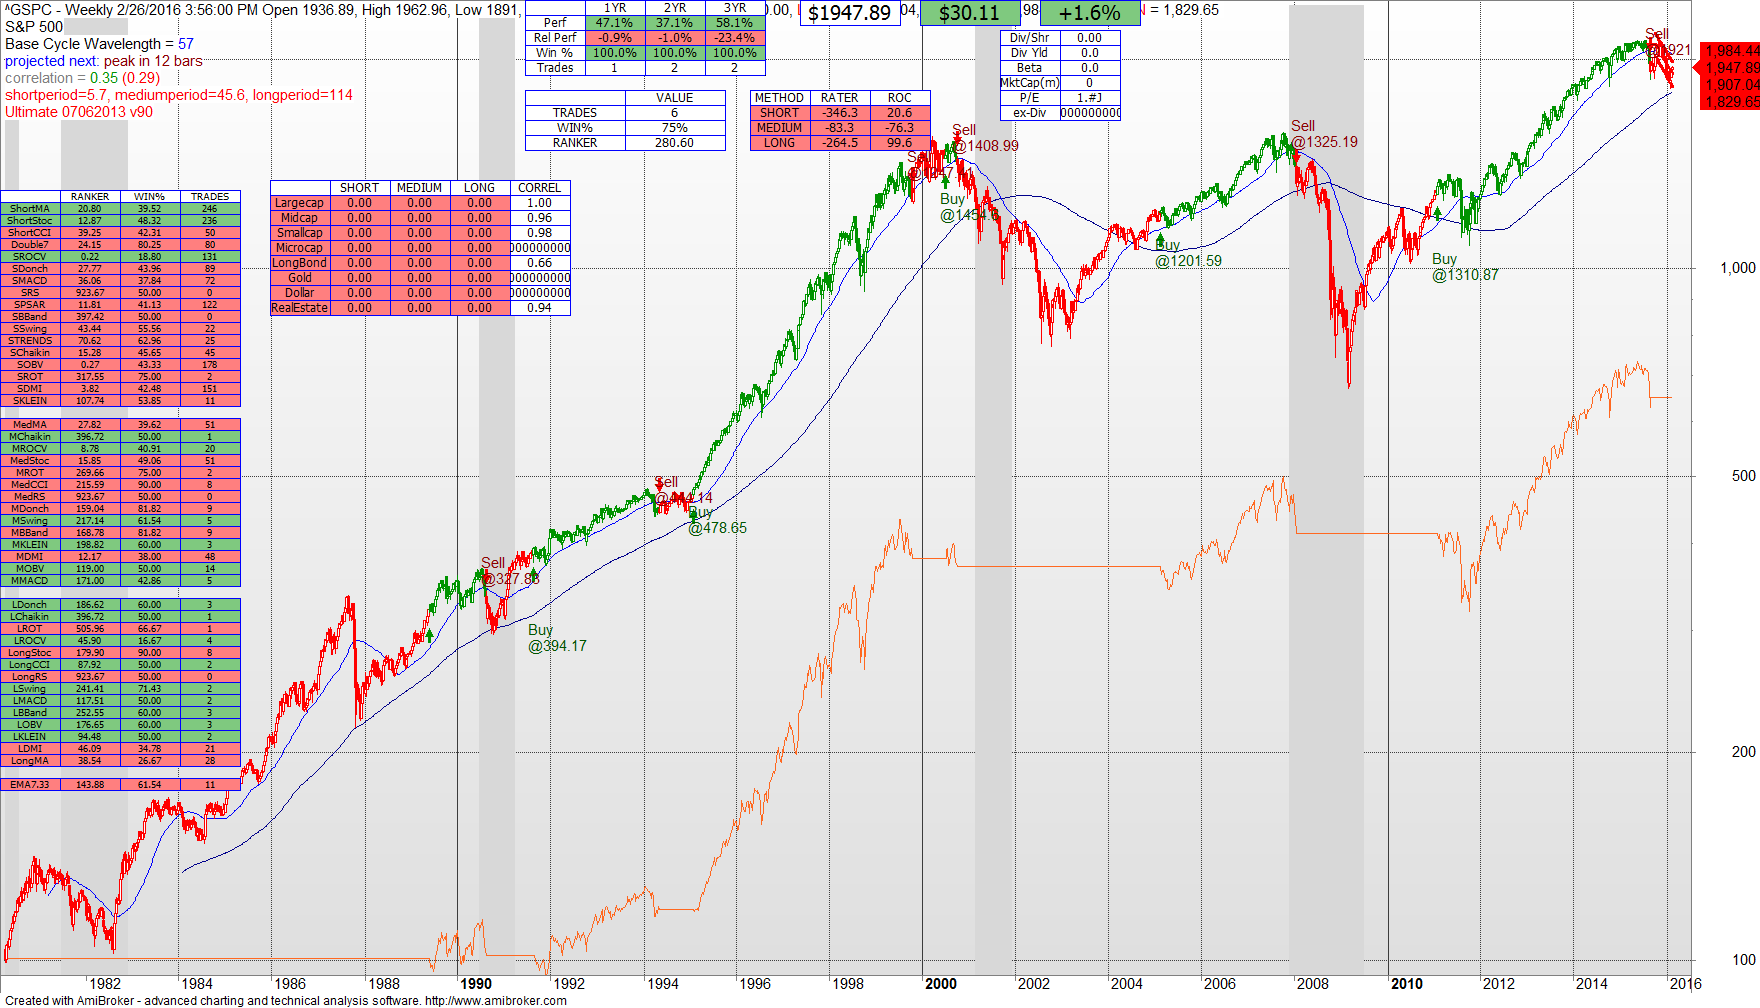
Below is a picture of the S&P since 1982. The shaded areas are official “recessionary” periods. At a weekly level the technical model is saying Sell in all periods. So we start with the overarching long term trend as downward.
A Daily view of the S&P also reveals weakness. The technical model is Sell in the Intermediate and Long term, consistent with the broader Weekly view. Note that the S&P is a BUY in the short term view.

An Hourly view of the S&P reveals short term emerging strength. The technical model is SELL in the hourly long term and intermediate term, but BUY in the near term hourly period.
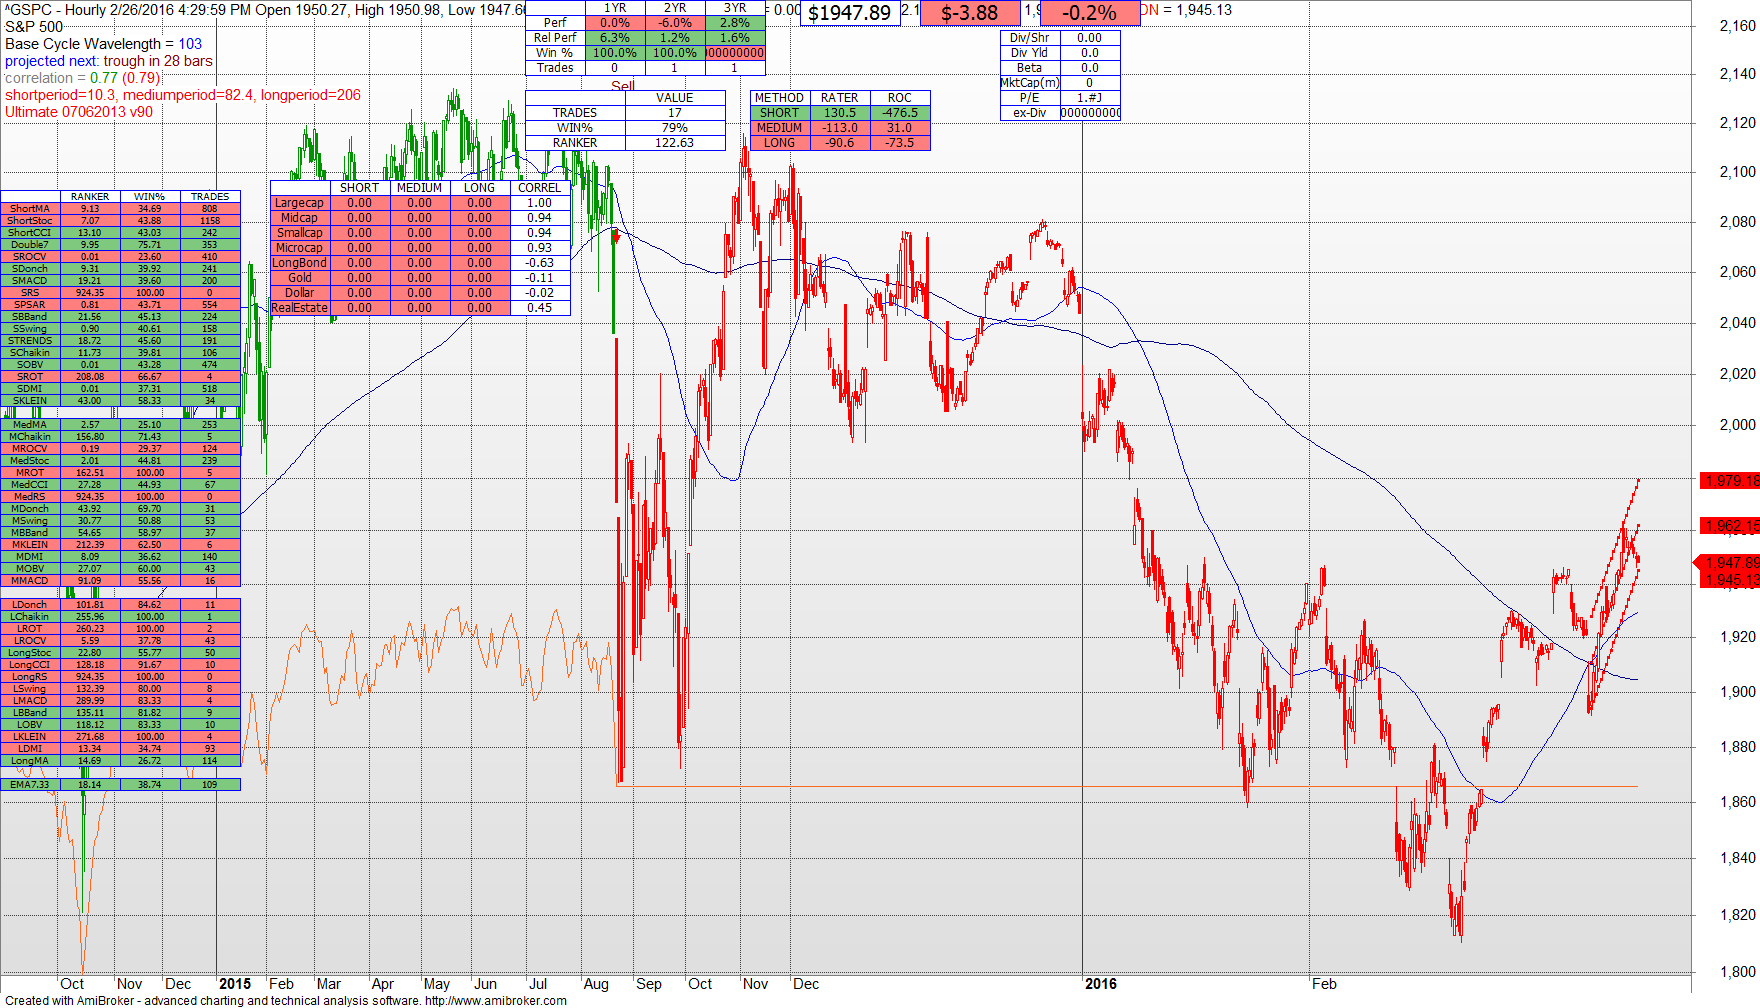
I believe what we are seeing is a short-term upward movement in the market but in the context of a broader, long term downward market.
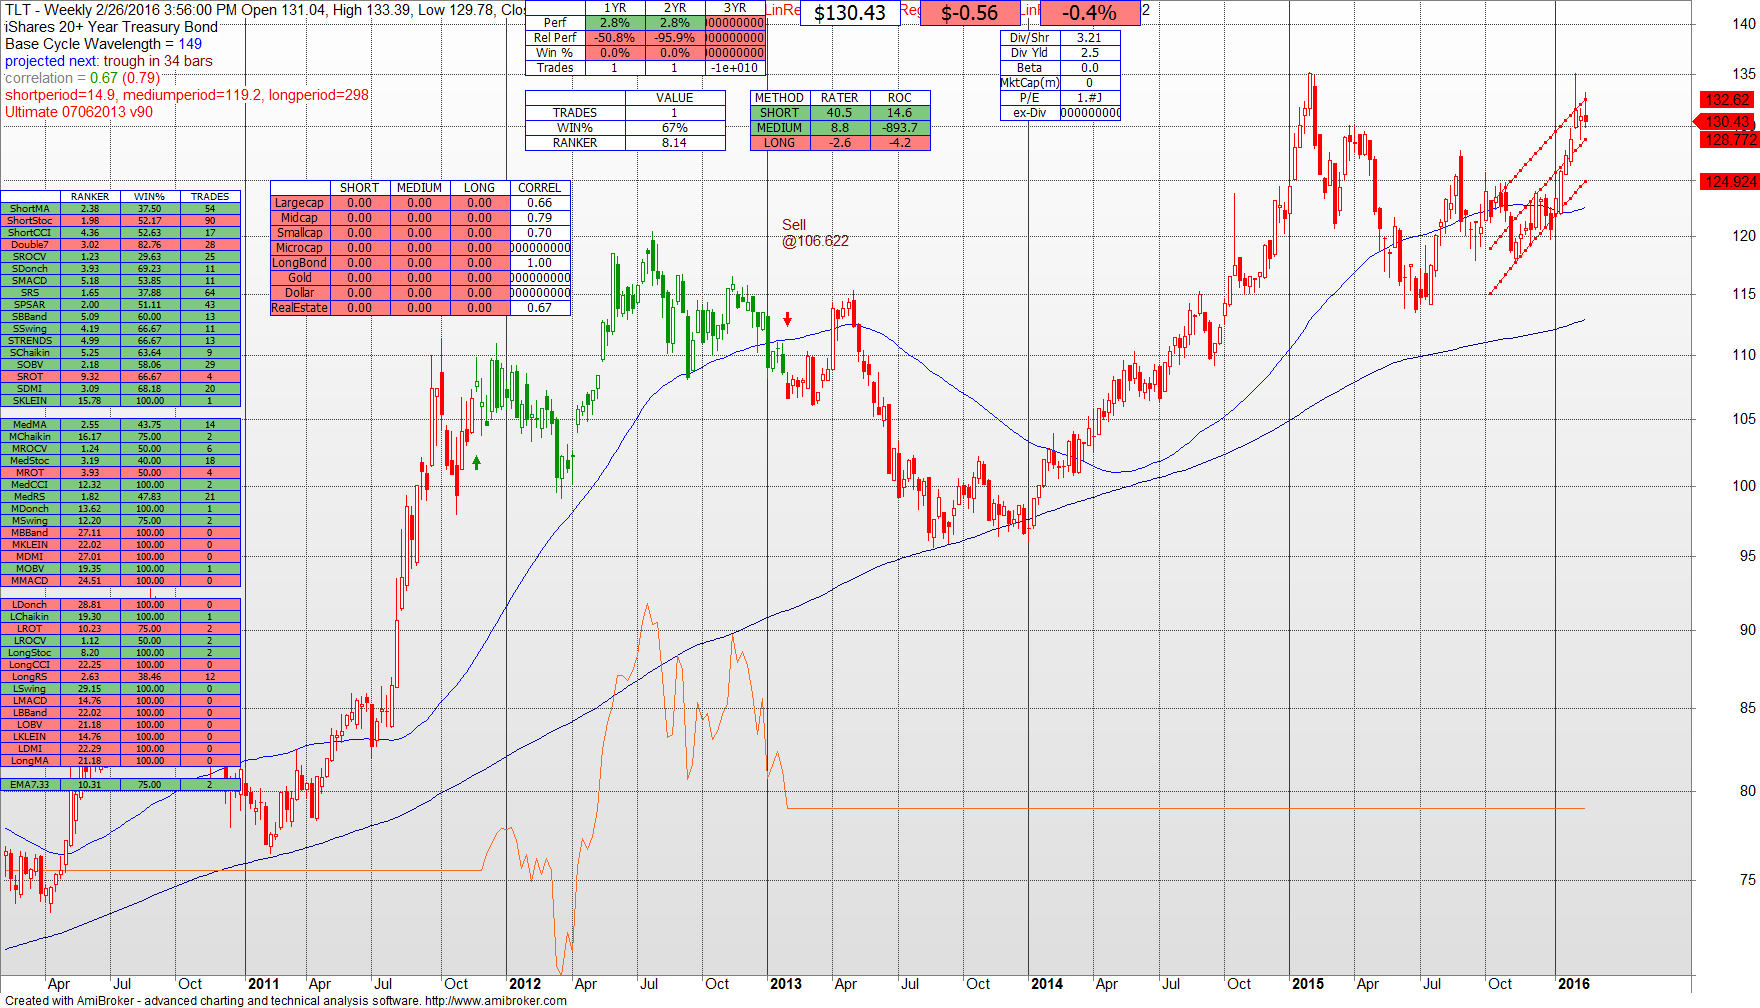
Turning attention to Bonds, the TLT ETF (Long Term Bonds) have been strong. On a weekly basis going back to 2010 the technical model is BUY in short and medium terms particularly in the past 18 months.
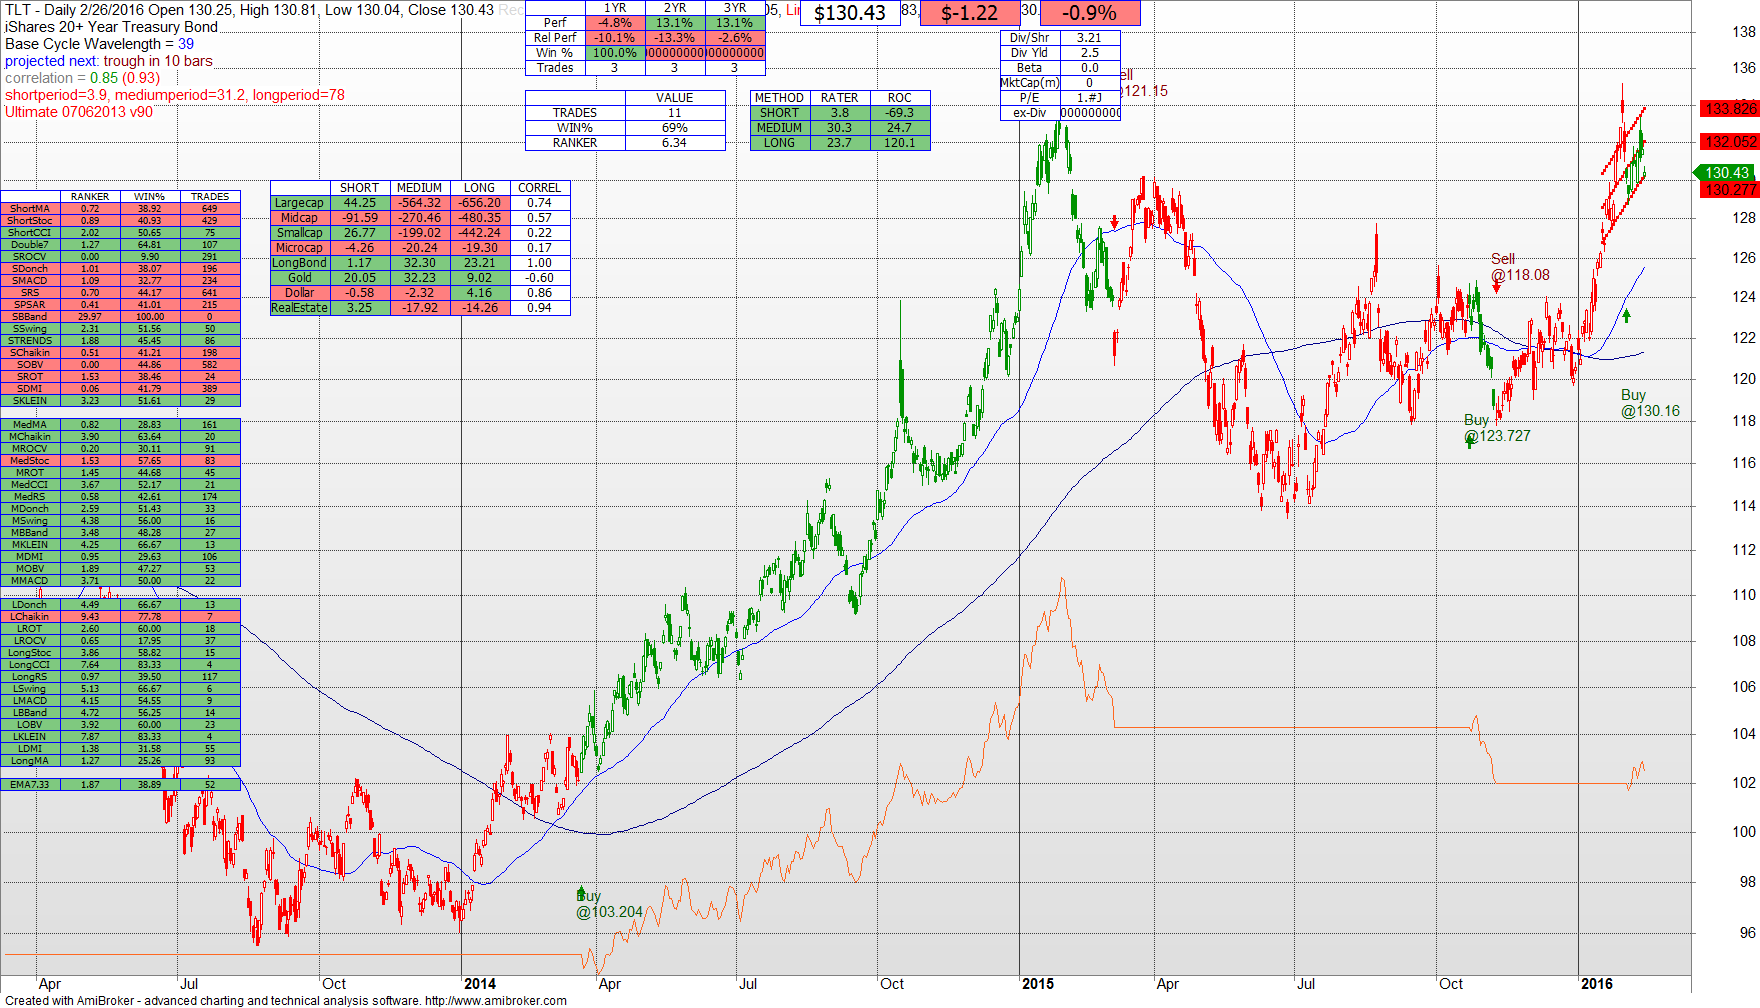
A Daily view of TLT reveals recent strength. It is now BUY in all periods. In some respects this is a confirmation of investor anxiety reflected in the high VIX and continuing concern about the market in general. It is also a reflection of the belief that the Fed has no room to further raise rates with an economy that is weaker than the Administration is advertising.
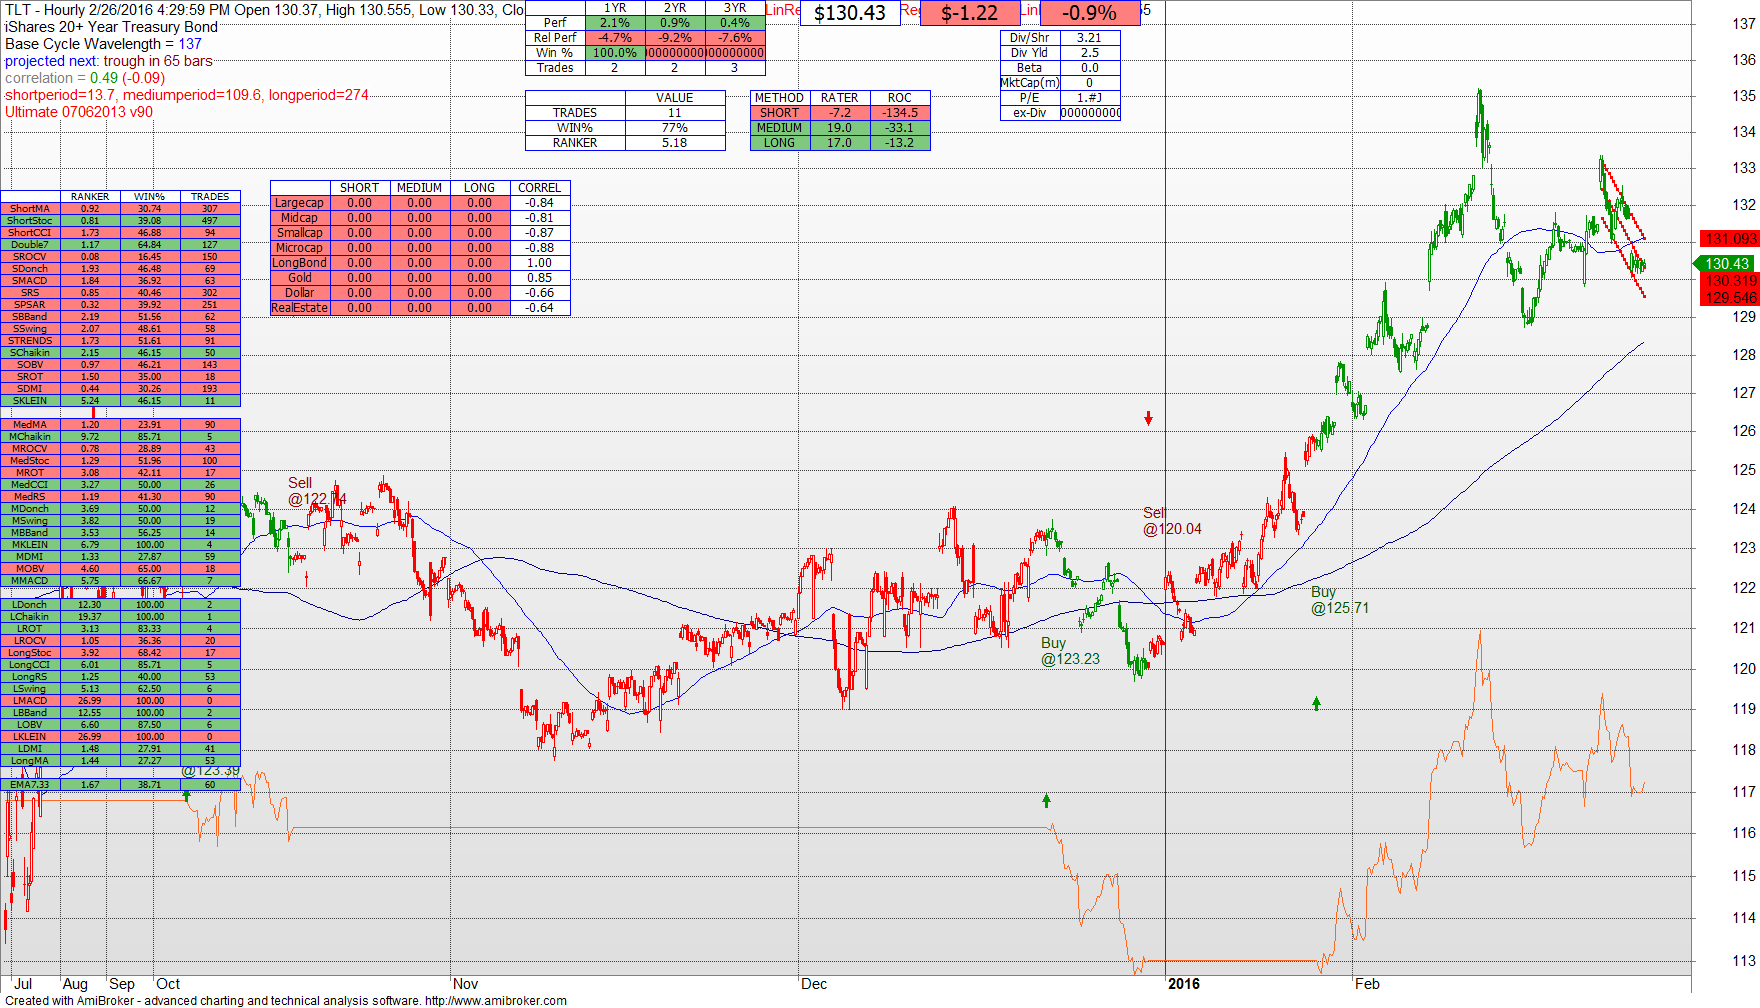
An Hourly view of TLT confirms the above. TLT has been a BUY on the hourly chart since late January.
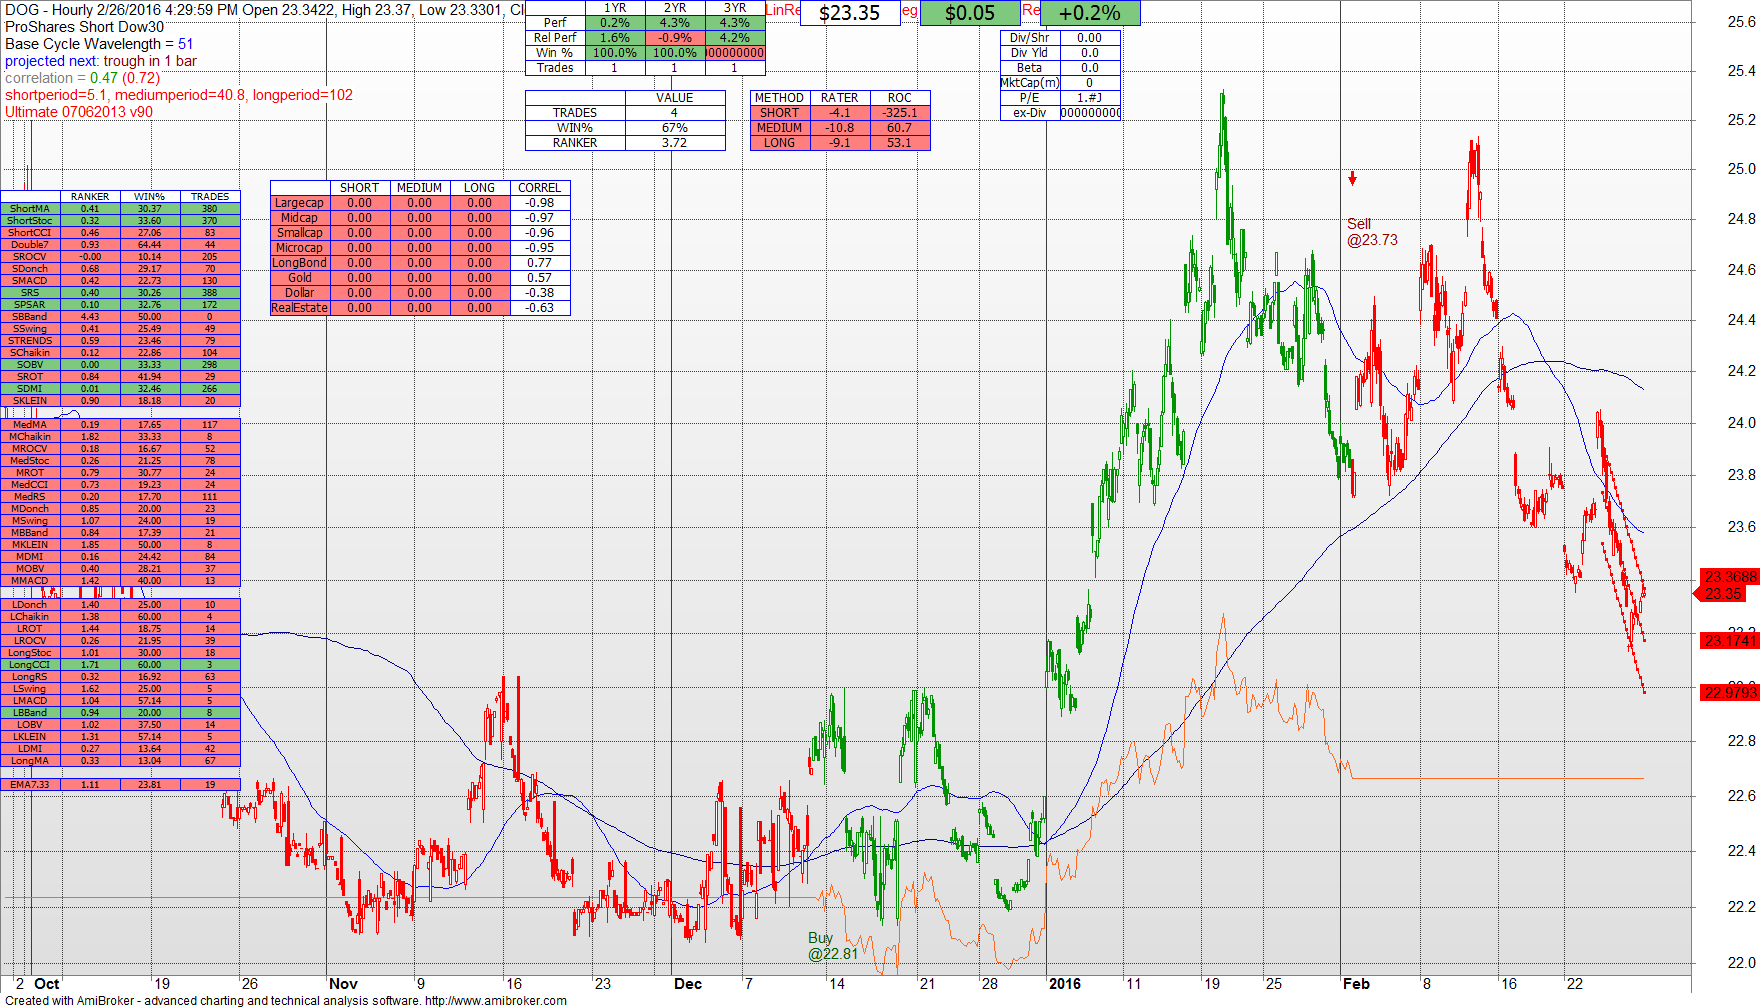
We are watching DOG, the inverse ETF, for an investing opportunity. There was an opportunity for investing back in mid-December, but the opportunity expired with a profit at the end of January. I will continue to keep you posted on the opportunity.
Overall, the recommendation for intermediate term investors (not short term traders) is an 80% fixed income / 20% market equity allocation as we protect principal and wait for a trend in this market.
