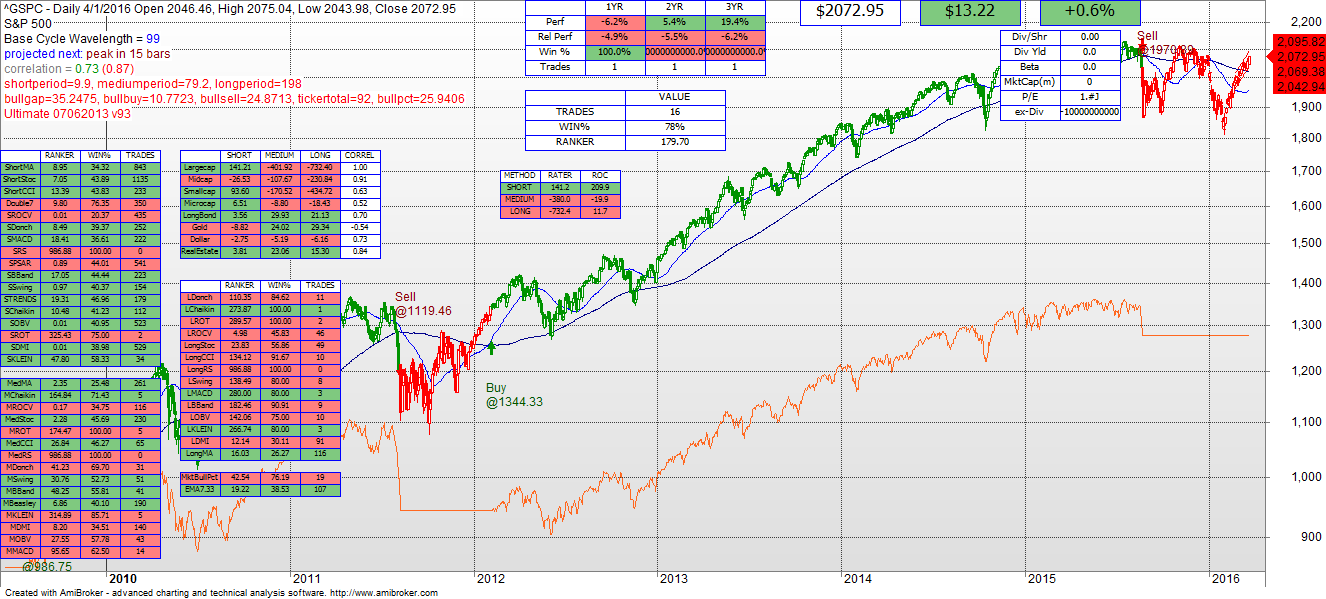
On an hourly basis, the technical model would have had you buy the S&P at 1967 on March 1. The S&P closed at 2072 on April 1. So were we to play that game, investing using hourly data, then we would be long the market.
Based on daily closing data however we continue to be out of the market, selling at 1970 and yes being out during the last run-up, as well as out during the interim drops to as low as 1850. This model is designed to be intermediate term, and it is biased against large draw downs. So the trend will have to fully reestablish before it will bring you back into this market. Historically it has a 78% win percentage and I believe that over time it will be useful.
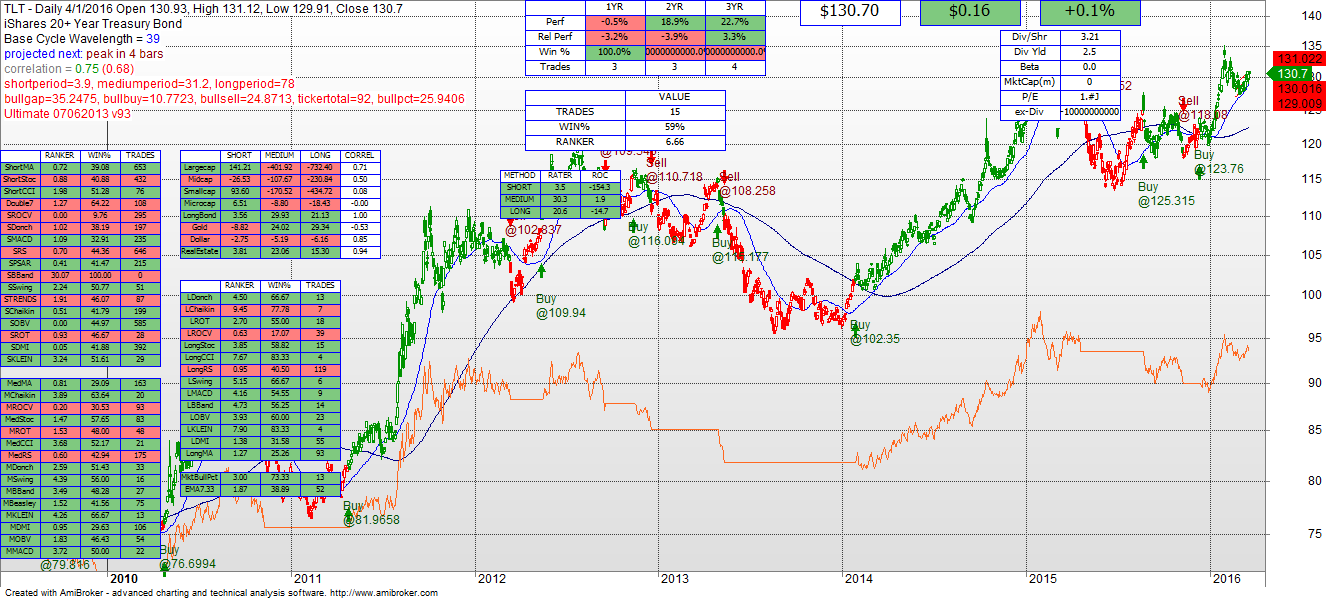
The long bonds had a buy signal at 123 and are presently at 130. There is near term volatility with every word out of the Fed, but for the moment it still makes sense to hold bonds for their relative predictability.
I have begun to experiment with adding market wide breadth and other indicators to the model including Bullish Percentage, which in one flavor is the percentage of S&P stocks that are bullish based on Point and Figure charting. I expect that this should further improve the intermediate and long term results.


