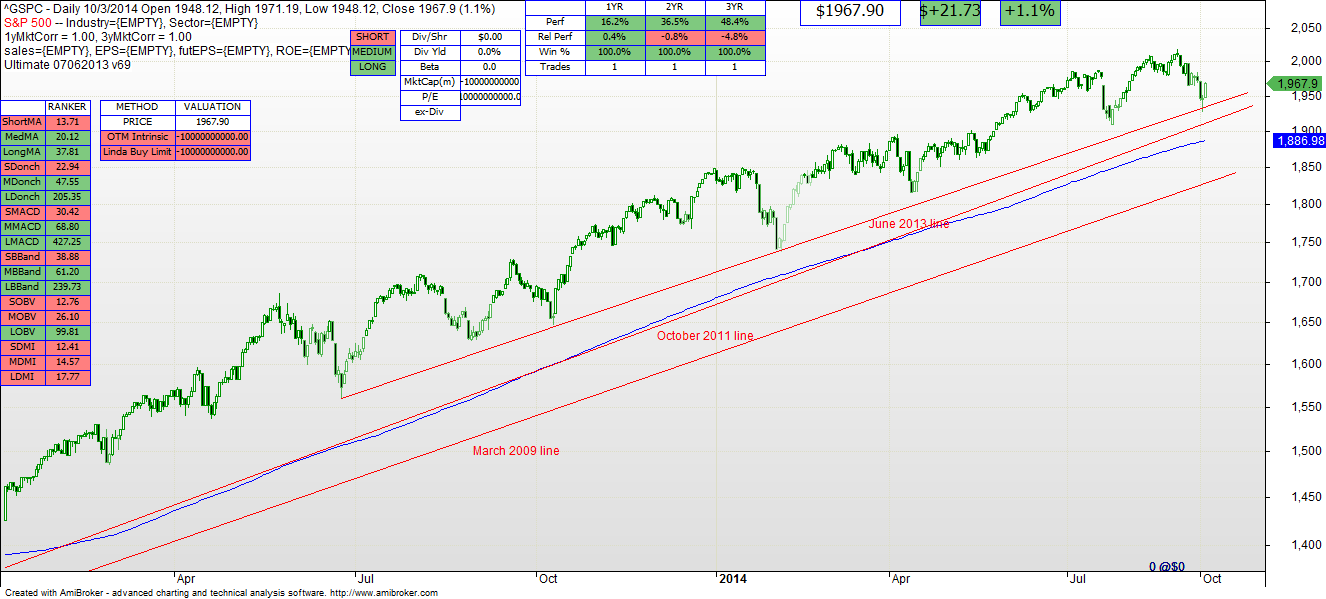
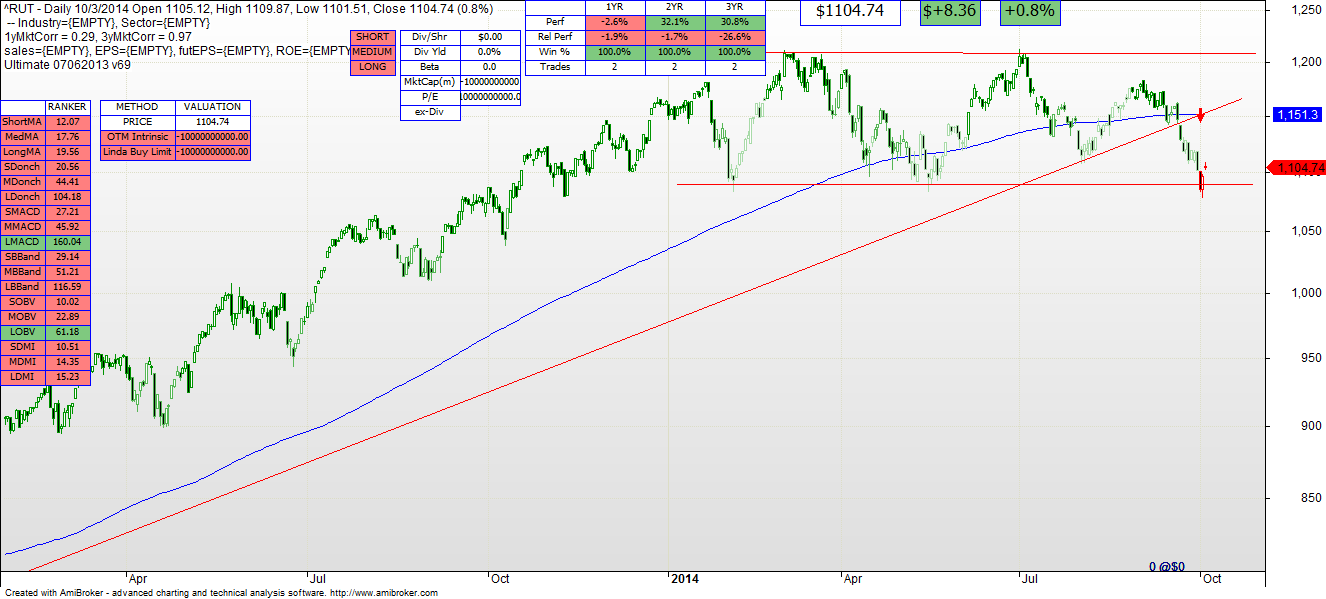
If you just look at the S&P 500 chart, you’ll see some volatility but no violation (yet) of long term trend lines. However, the Russell 2000 begs to disagree, and that is significant. The Russell 2000 is an index composed of the 2000 largest “small cap” stocks. While it is far more securities than the 500 in the S&P 500, the total capitalization of Russell 2000 companies is only 10% of the S&P 500 large cap stocks. Historically, small caps lead large caps, both up and down. And that is where the concern lies. The chart below is a four year picture of the Russell 2000. The index has dropped below its long term trend line. It is SELL on all three technical models. And the index is right at the neck of a head and shoulders pattern, which technically is a strong indication of a meaningful change in direction. Looking at the Russell 2000 over the more recent, shorter period, you can see the peril in the indicator. The S&P 500 has yet to violate the long term trend lines that I pointed out last week. But the increased volatility of the near term, coupled with the “divergence” of the Russell compared to the S&P, does raise a number of very serious questions about the strength of the current rally. Small companies have fallen — will large companies follow suit? Conclusion: Keep a very close eye on the S&P over the next week or two. We’ll let the models take us where they take us. But increased scrutiny is warranted.
Conservative. Smart. Investing.


