I have enhanced the OTM Technical Model to provide a current view of the overall market and an individual security’s correlation to that market. This can be useful in forecasting turning points in the market.
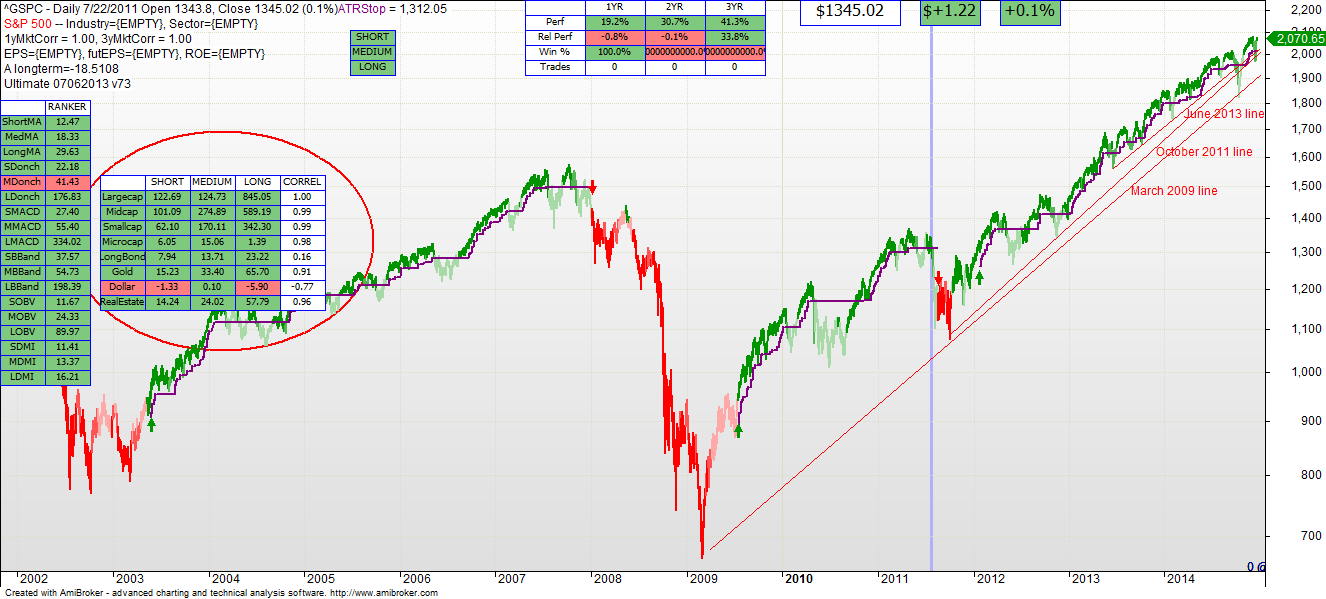
Note the above picture from July 22, 2011. It includes taking the various industry indexes for different market cap sizes, as well as gold and other investments, and applying the technical model to those. On this date, all of the major equity indexes were in line across all sizes of companies. All alternative investments that negatively correlate with the S&P were showing SELL. All was in line.
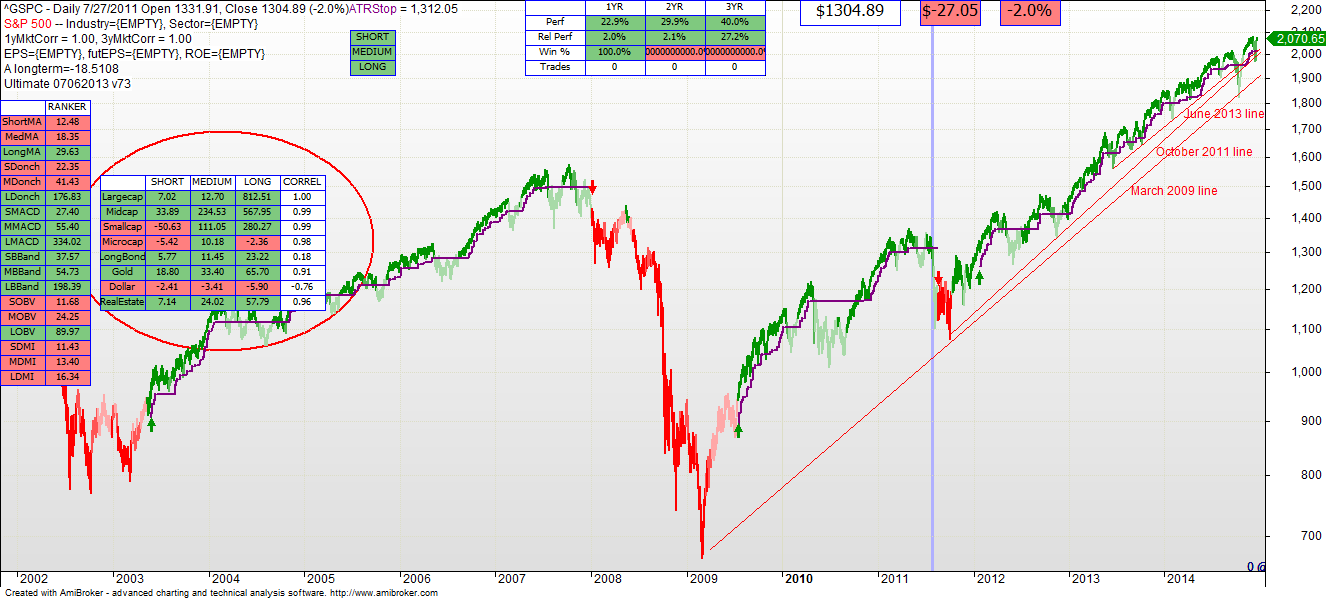
Initially as the market breaks down on July 27 you can see it in the short term model for the micro-caps and small caps above.
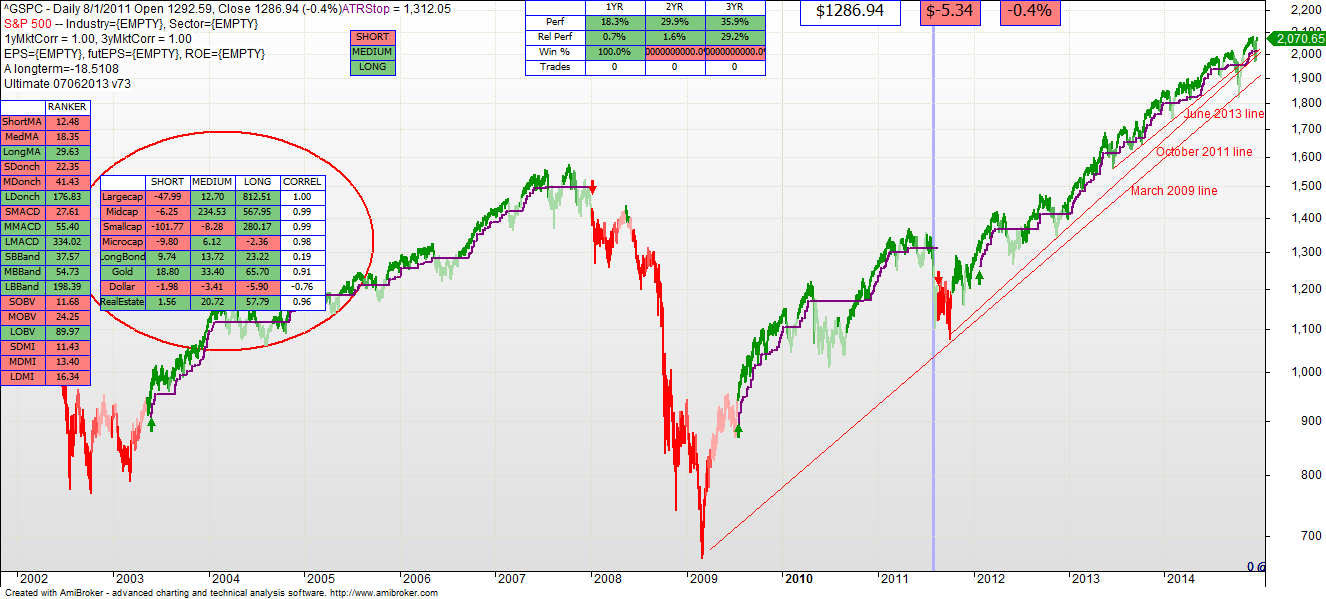
Then by August 1 you can see that small caps have turned to SELL in all periods, and the weakness is beginning to affect larger companies as noted in the short term period SELL for midcap and large (S&P) companies.
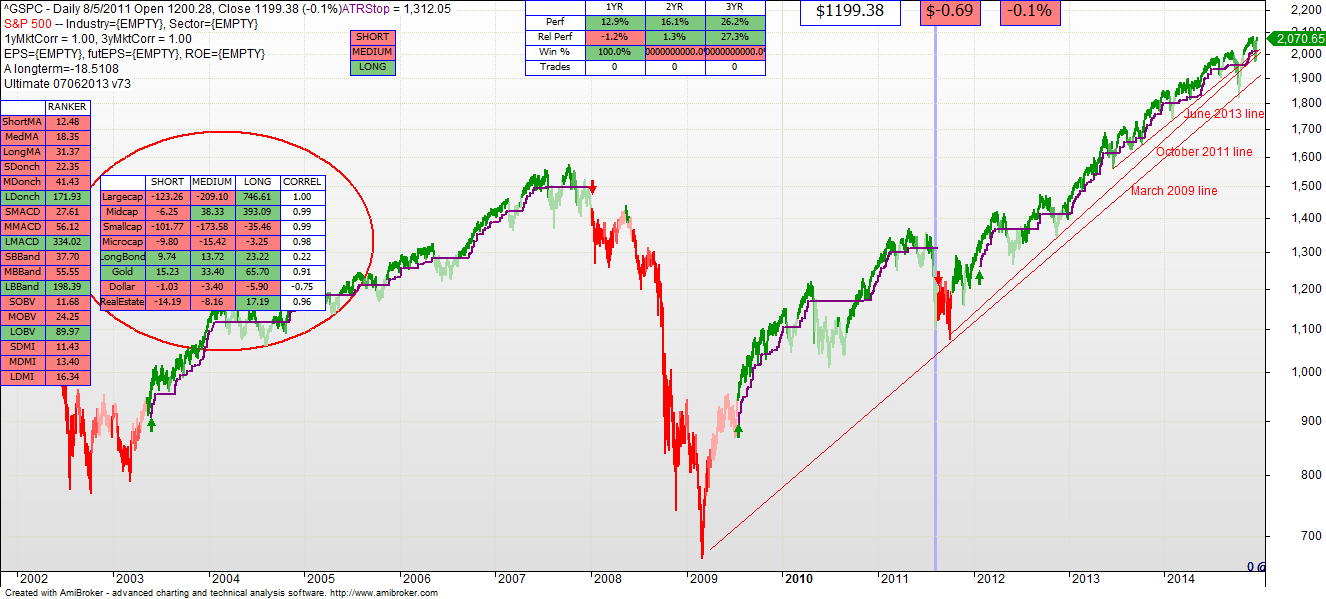
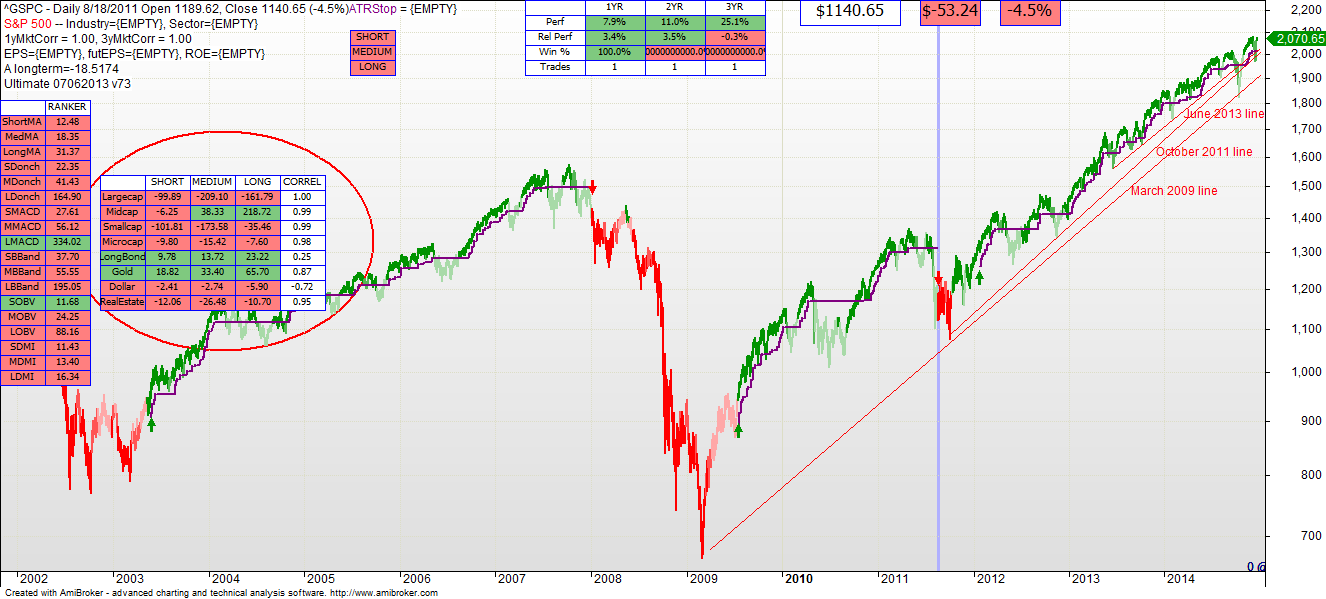
By August 5 you can see the broad weakness. Micro and Small caps are weak across all periods, and large caps are weakening across the medium term timeframe as well. Importantly, the negatively correlated Gold and Long Bonds remain strong, thereby confirming that a shift of sentiment is underway.
Then August 18 the weakness spread to the large caps across all periods. The model was recommending SELL of equities such as SPY and anything highly correlated to the S&P. Again, bonds and gold are strong.
This is a demonstration of how looking at various indices and non-correlated asset classes can help advise on the ongoing trend in the market in advance of making a specific purchase. This set of data has now been added to the model and available on all individual stock charts.
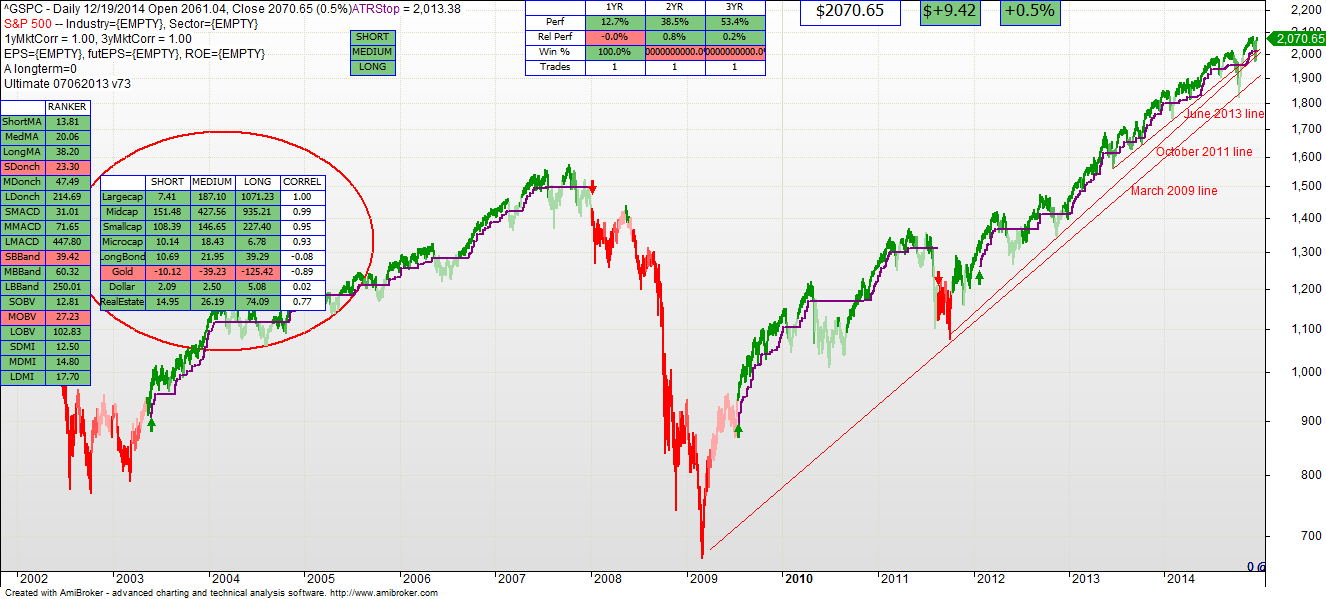
Finally here is a picture of the model today. All major equity indices are BUY. As you can see Gold is SELL in all periods, and as it is inversely correlated to the market in general, that is a confirming indicator to the overall market trend.

